Counties with the highest rate of food insecurity in Missouri

Kbh3rd // Wikimedia Commons
Counties with the highest rate of food insecurity in Missouri
Every county in the United States is home to people experiencing food insecurity, defined by the nonprofit Feeding America as “a lack of consistent access to enough food for every person in a household to live an active, healthy life.”
The USDA estimates that 89.5% of U.S. households were food secure throughout 2019—that’s 116.0 million people. The COVID-19 pandemic put further strain on households already experiencing food hardship, with Feeding America estimating that 42 million people, or 1 in 8 Americans, may experience food insecurity in 2021. This is a slight improvement from 2020 numbers but still represents an enormous burden for millions of children and adults.
Stacker compiled a list of counties in Missouri with the highest rate of food insecurity using data from Feeding America. Counties are ranked by highest percent of population with food insecurity as of 2019.
![]()

thomas carr // Shutterstock
#50. Webster County
– Food insecurity rate: 15.1% (5,850 total)
— 38.5% higher than national average
– Child food insecurity rate: 17.8% (1,860 total)
— 21.9% higher than national average
– Annual food budget shortfall: $2,952,000
— Cost per meal: $2.95

Kbh3rd // Wikimedia Commons
#49. Maries County
– Food insecurity rate: 15.2% (1,340 total)
— 39.4% higher than national average
– Child food insecurity rate: 19.3% (340 total)
— 32.2% higher than national average
– Annual food budget shortfall: $691,000
— Cost per meal: $3.02

Kbh3rd // Wikimedia Commons
#48. Randolph County
– Food insecurity rate: 15.2% (3,780 total)
— 39.4% higher than national average
– Child food insecurity rate: 18.2% (990 total)
— 24.7% higher than national average
– Annual food budget shortfall: $1,713,000
— Cost per meal: $2.65

Kbh3rd // Wikimedia Commons
#47. Miller County
– Food insecurity rate: 15.2% (3,820 total)
— 39.4% higher than national average
– Child food insecurity rate: 18.2% (1,090 total)
— 24.7% higher than national average
– Annual food budget shortfall: $2,231,000
— Cost per meal: $3.42

Andrew.Belair // Wikimedia Commons
#46. Adair County
– Food insecurity rate: 15.2% (3,850 total)
— 39.4% higher than national average
– Child food insecurity rate: 13.6% (640 total)
— 6.8% lower than national average
– Annual food budget shortfall: $1,809,000
— Cost per meal: $2.75

Kbh3rd // Wikimedia Commons
#45. Lawrence County
– Food insecurity rate: 15.2% (5,800 total)
— 39.4% higher than national average
– Child food insecurity rate: 18.8% (1,820 total)
— 28.8% higher than national average
– Annual food budget shortfall: $2,930,000
— Cost per meal: $2.96

Kbh3rd // Wikimedia Commons
#44. Grundy County
– Food insecurity rate: 15.5% (1,550 total)
— 42.2% higher than national average
– Child food insecurity rate: 15.9% (370 total)
— 8.9% higher than national average
– Annual food budget shortfall: $803,000
— Cost per meal: $3.03

Skye Marthaler, retouched by Kbh3rd // Wikimedia Commons
#43. Bollinger County
– Food insecurity rate: 15.5% (1,890 total)
— 42.2% higher than national average
– Child food insecurity rate: 17.7% (470 total)
— 21.2% higher than national average
– Annual food budget shortfall: $947,000
— Cost per meal: $2.93

Canva
#42. Knox County
– Food insecurity rate: 15.6% (620 total)
— 43.1% higher than national average
– Child food insecurity rate: 17.6% (170 total)
— 20.5% higher than national average
– Annual food budget shortfall: $304,000
— Cost per meal: $2.87

Kbh3rd // Wikimedia Commons
#41. Carter County
– Food insecurity rate: 15.6% (960 total)
— 43.1% higher than national average
– Child food insecurity rate: 16.5% (240 total)
— 13.0% higher than national average
– Annual food budget shortfall: $448,000
— Cost per meal: $2.73

Americasroof // Wikimedia Commons
#40. Harrison County
– Food insecurity rate: 15.6% (1,330 total)
— 43.1% higher than national average
– Child food insecurity rate: 17.7% (370 total)
— 21.2% higher than national average
– Annual food budget shortfall: $705,000
— Cost per meal: $3.10

Kbh3rd // Wikimedia Commons
#39. Pulaski County
– Food insecurity rate: 15.8% (8,290 total)
— 45.0% higher than national average
– Child food insecurity rate: 17.6% (2,020 total)
— 20.5% higher than national average
– Annual food budget shortfall: $4,531,000
— Cost per meal: $3.20

Sean Pavone // Shutterstock
#38. St. Louis city
– Food insecurity rate: 15.8% (48,840 total)
— 45.0% higher than national average
– Child food insecurity rate: 23.4% (14,000 total)
— 60.3% higher than national average
– Annual food budget shortfall: $28,295,000
— Cost per meal: $3.39

Bungaloid // Wikimedia Commons
#37. Cedar County
– Food insecurity rate: 15.9% (2,240 total)
— 45.9% higher than national average
– Child food insecurity rate: 17.5% (590 total)
— 19.9% higher than national average
– Annual food budget shortfall: $1,078,000
— Cost per meal: $2.82

Kbh3rd // Wikimedia Commons
#36. Dallas County
– Food insecurity rate: 15.9% (2,640 total)
— 45.9% higher than national average
– Child food insecurity rate: 17.1% (670 total)
— 17.1% higher than national average
– Annual food budget shortfall: $1,354,000
— Cost per meal: $3.00

Lilith Munck // Shutterstock
#35. Taney County
– Food insecurity rate: 16.0% (8,810 total)
— 46.8% higher than national average
– Child food insecurity rate: 17.9% (2,090 total)
— 22.6% higher than national average
– Annual food budget shortfall: $4,938,000
— Cost per meal: $3.28

Kbh3rd // Wikimedia Commons
#34. Dade County
– Food insecurity rate: 16.1% (1,220 total)
— 47.7% higher than national average
– Child food insecurity rate: 22.4% (350 total)
— 53.4% higher than national average
– Annual food budget shortfall: $615,000
— Cost per meal: $2.95

Parker Botanical // Wikimedia Commons
#33. Madison County
– Food insecurity rate: 16.1% (1,960 total)
— 47.7% higher than national average
– Child food insecurity rate: 16.4% (460 total)
— 12.3% higher than national average
– Annual food budget shortfall: $974,000
— Cost per meal: $2.91

Paul Sableman // Wikimedia Commons
#32. St. Francois County
– Food insecurity rate: 16.1% (10,720 total)
— 47.7% higher than national average
– Child food insecurity rate: 17.6% (2,460 total)
— 20.5% higher than national average
– Annual food budget shortfall: $5,236,000
— Cost per meal: $2.86

Kbh3rd // Wikimedia Commons
#31. Barry County
– Food insecurity rate: 16.2% (5,770 total)
— 48.6% higher than national average
– Child food insecurity rate: 19.7% (1,580 total)
— 34.9% higher than national average
– Annual food budget shortfall: $2,933,000
— Cost per meal: $2.97

Kbh3rd // Wikimedia Commons
#30. Phelps County
– Food insecurity rate: 16.3% (7,290 total)
— 49.5% higher than national average
– Child food insecurity rate: 15.9% (1,500 total)
— 8.9% higher than national average
– Annual food budget shortfall: $3,489,000
— Cost per meal: $2.80

Kbh3rd // Wikimedia Commons
#29. Schuyler County
– Food insecurity rate: 16.4% (750 total)
— 50.5% higher than national average
– Child food insecurity rate: 17.8% (210 total)
— 21.9% higher than national average
– Annual food budget shortfall: $353,000
— Cost per meal: $2.75

M. Curtis // Shutterstock
#28. Laclede County
– Food insecurity rate: 16.5% (5,880 total)
— 51.4% higher than national average
– Child food insecurity rate: 19.3% (1,680 total)
— 32.2% higher than national average
– Annual food budget shortfall: $2,686,000
— Cost per meal: $2.67

Dazspell // Wikimedia Commons
#27. Scott County
– Food insecurity rate: 16.5% (6,390 total)
— 51.4% higher than national average
– Child food insecurity rate: 21.3% (1,960 total)
— 45.9% higher than national average
– Annual food budget shortfall: $3,194,000
— Cost per meal: $2.92

TommyBrison // Shutterstock
#26. St. Clair County
– Food insecurity rate: 16.7% (1,570 total)
— 53.2% higher than national average
– Child food insecurity rate: 20.1% (370 total)
— 37.7% higher than national average
– Annual food budget shortfall: $743,000
— Cost per meal: $2.77

Kbh3rd // Wikimedia Commons
#25. Crawford County
– Food insecurity rate: 16.8% (4,060 total)
— 54.1% higher than national average
– Child food insecurity rate: 19.3% (1,070 total)
— 32.2% higher than national average
– Annual food budget shortfall: $2,125,000
— Cost per meal: $3.06

Kbh3rd // Wikimedia Commons
#24. Barton County
– Food insecurity rate: 17.1% (2,010 total)
— 56.9% higher than national average
– Child food insecurity rate: 18.9% (530 total)
— 29.5% higher than national average
– Annual food budget shortfall: $967,000
— Cost per meal: $2.81

Kbh3rd // Wikimedia Commons
#23. Hickory County
– Food insecurity rate: 17.3% (1,630 total)
— 58.7% higher than national average
– Child food insecurity rate: 19.5% (310 total)
— 33.6% higher than national average
– Annual food budget shortfall: $789,000
— Cost per meal: $2.83

Brian Hunter // Wikimedia Commons
#22. Benton County
– Food insecurity rate: 17.3% (3,310 total)
— 58.7% higher than national average
– Child food insecurity rate: 23.2% (770 total)
— 58.9% higher than national average
– Annual food budget shortfall: $1,683,000
— Cost per meal: $2.97

Sector001 // Wikimedia Commons
#21. Morgan County
– Food insecurity rate: 17.4% (3,520 total)
— 59.6% higher than national average
– Child food insecurity rate: 21.6% (1,000 total)
— 47.9% higher than national average
– Annual food budget shortfall: $1,715,000
— Cost per meal: $2.85

Kbh3rd // Wikimedia Commons
#20. Henry County
– Food insecurity rate: 17.4% (3,780 total)
— 59.6% higher than national average
– Child food insecurity rate: 21.3% (1,020 total)
— 45.9% higher than national average
– Annual food budget shortfall: $1,739,000
— Cost per meal: $2.69

Kbh3rd // Wikimedia Commons
#19. Reynolds County
– Food insecurity rate: 17.7% (1,120 total)
— 62.4% higher than national average
– Child food insecurity rate: 22.4% (280 total)
— 53.4% higher than national average
– Annual food budget shortfall: $537,000
— Cost per meal: $2.81

Americasroof // Wikimedia Commons
#18. Washington County
– Food insecurity rate: 17.8% (4,430 total)
— 63.3% higher than national average
– Child food insecurity rate: 21.0% (1,190 total)
— 43.8% higher than national average
– Annual food budget shortfall: $2,122,000
— Cost per meal: $2.80

Vsmith // Wikimedia Commons
#17. Douglas County
– Food insecurity rate: 17.9% (2,380 total)
— 64.2% higher than national average
– Child food insecurity rate: 23.0% (670 total)
— 57.5% higher than national average
– Annual food budget shortfall: $1,235,000
— Cost per meal: $3.03

Brian Stansberry // Wikimedia Commons
#16. Stoddard County
– Food insecurity rate: 18.1% (5,320 total)
— 66.1% higher than national average
– Child food insecurity rate: 20.9% (1,370 total)
— 43.2% higher than national average
– Annual food budget shortfall: $2,661,000
— Cost per meal: $2.93
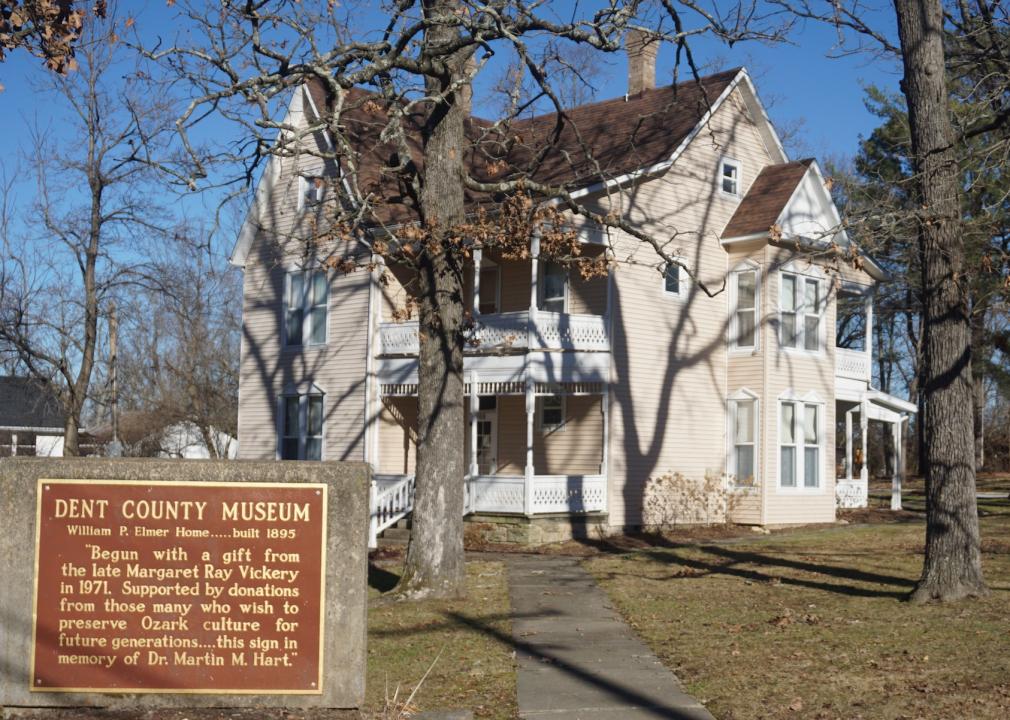
Steveewatkins // Wikimedia Commons
#15. Dent County
– Food insecurity rate: 18.3% (2,840 total)
— 67.9% higher than national average
– Child food insecurity rate: 22.1% (780 total)
— 51.4% higher than national average
– Annual food budget shortfall: $1,425,000
— Cost per meal: $2.94

Joseph Sohm // Shutterstock
#14. New Madrid County
– Food insecurity rate: 18.3% (3,220 total)
— 67.9% higher than national average
– Child food insecurity rate: 24.8% (1,020 total)
— 69.9% higher than national average
– Annual food budget shortfall: $1,518,000
— Cost per meal: $2.76

Brian Stansberry // Wikimedia Commons
#13. Mississippi County
– Food insecurity rate: 18.7% (2,540 total)
— 71.6% higher than national average
– Child food insecurity rate: 24.1% (690 total)
— 65.1% higher than national average
– Annual food budget shortfall: $1,201,000
— Cost per meal: $2.77

Kbh3rd // Wikimedia Commons
#12. Howell County
– Food insecurity rate: 18.8% (7,540 total)
— 72.5% higher than national average
– Child food insecurity rate: 22.0% (2,110 total)
— 50.7% higher than national average
– Annual food budget shortfall: $3,544,000
— Cost per meal: $2.75

Kbh3rd // Wikimedia Commons
#11. Wright County
– Food insecurity rate: 19.5% (3,560 total)
— 78.9% higher than national average
– Child food insecurity rate: 25.0% (1,160 total)
— 71.2% higher than national average
– Annual food budget shortfall: $1,701,000
— Cost per meal: $2.79

Kbh3rd // Wikimedia Commons
#10. Iron County
– Food insecurity rate: 19.6% (2,000 total)
— 79.8% higher than national average
– Child food insecurity rate: 23.3% (490 total)
— 59.6% higher than national average
– Annual food budget shortfall: $976,000
— Cost per meal: $2.85

Kbh3rd // Wikimedia Commons
#9. Oregon County
– Food insecurity rate: 19.7% (2,100 total)
— 80.7% higher than national average
– Child food insecurity rate: 25.7% (620 total)
— 76.0% higher than national average
– Annual food budget shortfall: $1,009,000
— Cost per meal: $2.81

Kbh3rd // Wikimedia Commons
#8. Texas County
– Food insecurity rate: 19.9% (5,110 total)
— 82.6% higher than national average
– Child food insecurity rate: 23.6% (1,310 total)
— 61.6% higher than national average
– Annual food budget shortfall: $2,549,000
— Cost per meal: $2.92

Skye Marthaler // Wikimedia Commons
#7. Butler County
– Food insecurity rate: 19.9% (8,480 total)
— 82.6% higher than national average
– Child food insecurity rate: 25.1% (2,520 total)
— 71.9% higher than national average
– Annual food budget shortfall: $3,858,000
— Cost per meal: $2.66

Kbh3rd // Wikimedia Commons
#6. Dunklin County
– Food insecurity rate: 20.1% (6,030 total)
— 84.4% higher than national average
– Child food insecurity rate: 25.5% (1,960 total)
— 74.7% higher than national average
– Annual food budget shortfall: $2,685,000
— Cost per meal: $2.60

Brian Stansberry // Wikimedia Commons
#5. Pemiscot County
– Food insecurity rate: 20.9% (3,480 total)
— 91.7% higher than national average
– Child food insecurity rate: 29.5% (1,280 total)
— 102.1% higher than national average
– Annual food budget shortfall: $1,657,000
— Cost per meal: $2.78

Kbh3rd // Wikimedia Commons
#4. Wayne County
– Food insecurity rate: 21.1% (2,780 total)
— 93.6% higher than national average
– Child food insecurity rate: 23.9% (680 total)
— 63.7% higher than national average
– Annual food budget shortfall: $1,305,000
— Cost per meal: $2.75

Dean Sebourn // Wikimedia Commons
#3. Ripley County
– Food insecurity rate: 21.7% (2,940 total)
— 99.1% higher than national average
– Child food insecurity rate: 26.3% (820 total)
— 80.1% higher than national average
– Annual food budget shortfall: $1,360,000
— Cost per meal: $2.71

christopher friese // Wikimedia Commons
#2. Shannon County
– Food insecurity rate: 21.8% (1,790 total)
— 100.0% higher than national average
– Child food insecurity rate: 25.6% (460 total)
— 75.3% higher than national average
– Annual food budget shortfall: $859,000
— Cost per meal: $2.81

Kbh3rd // Wikimedia Commons
#1. Ozark County
– Food insecurity rate: 21.8% (2,000 total)
— 100.0% higher than national average
– Child food insecurity rate: 29.2% (530 total)
— 100.0% higher than national average
– Annual food budget shortfall: $1,047,000
— Cost per meal: $3.06