States with the highest rates of small business employment

David Gyung // Shutterstock
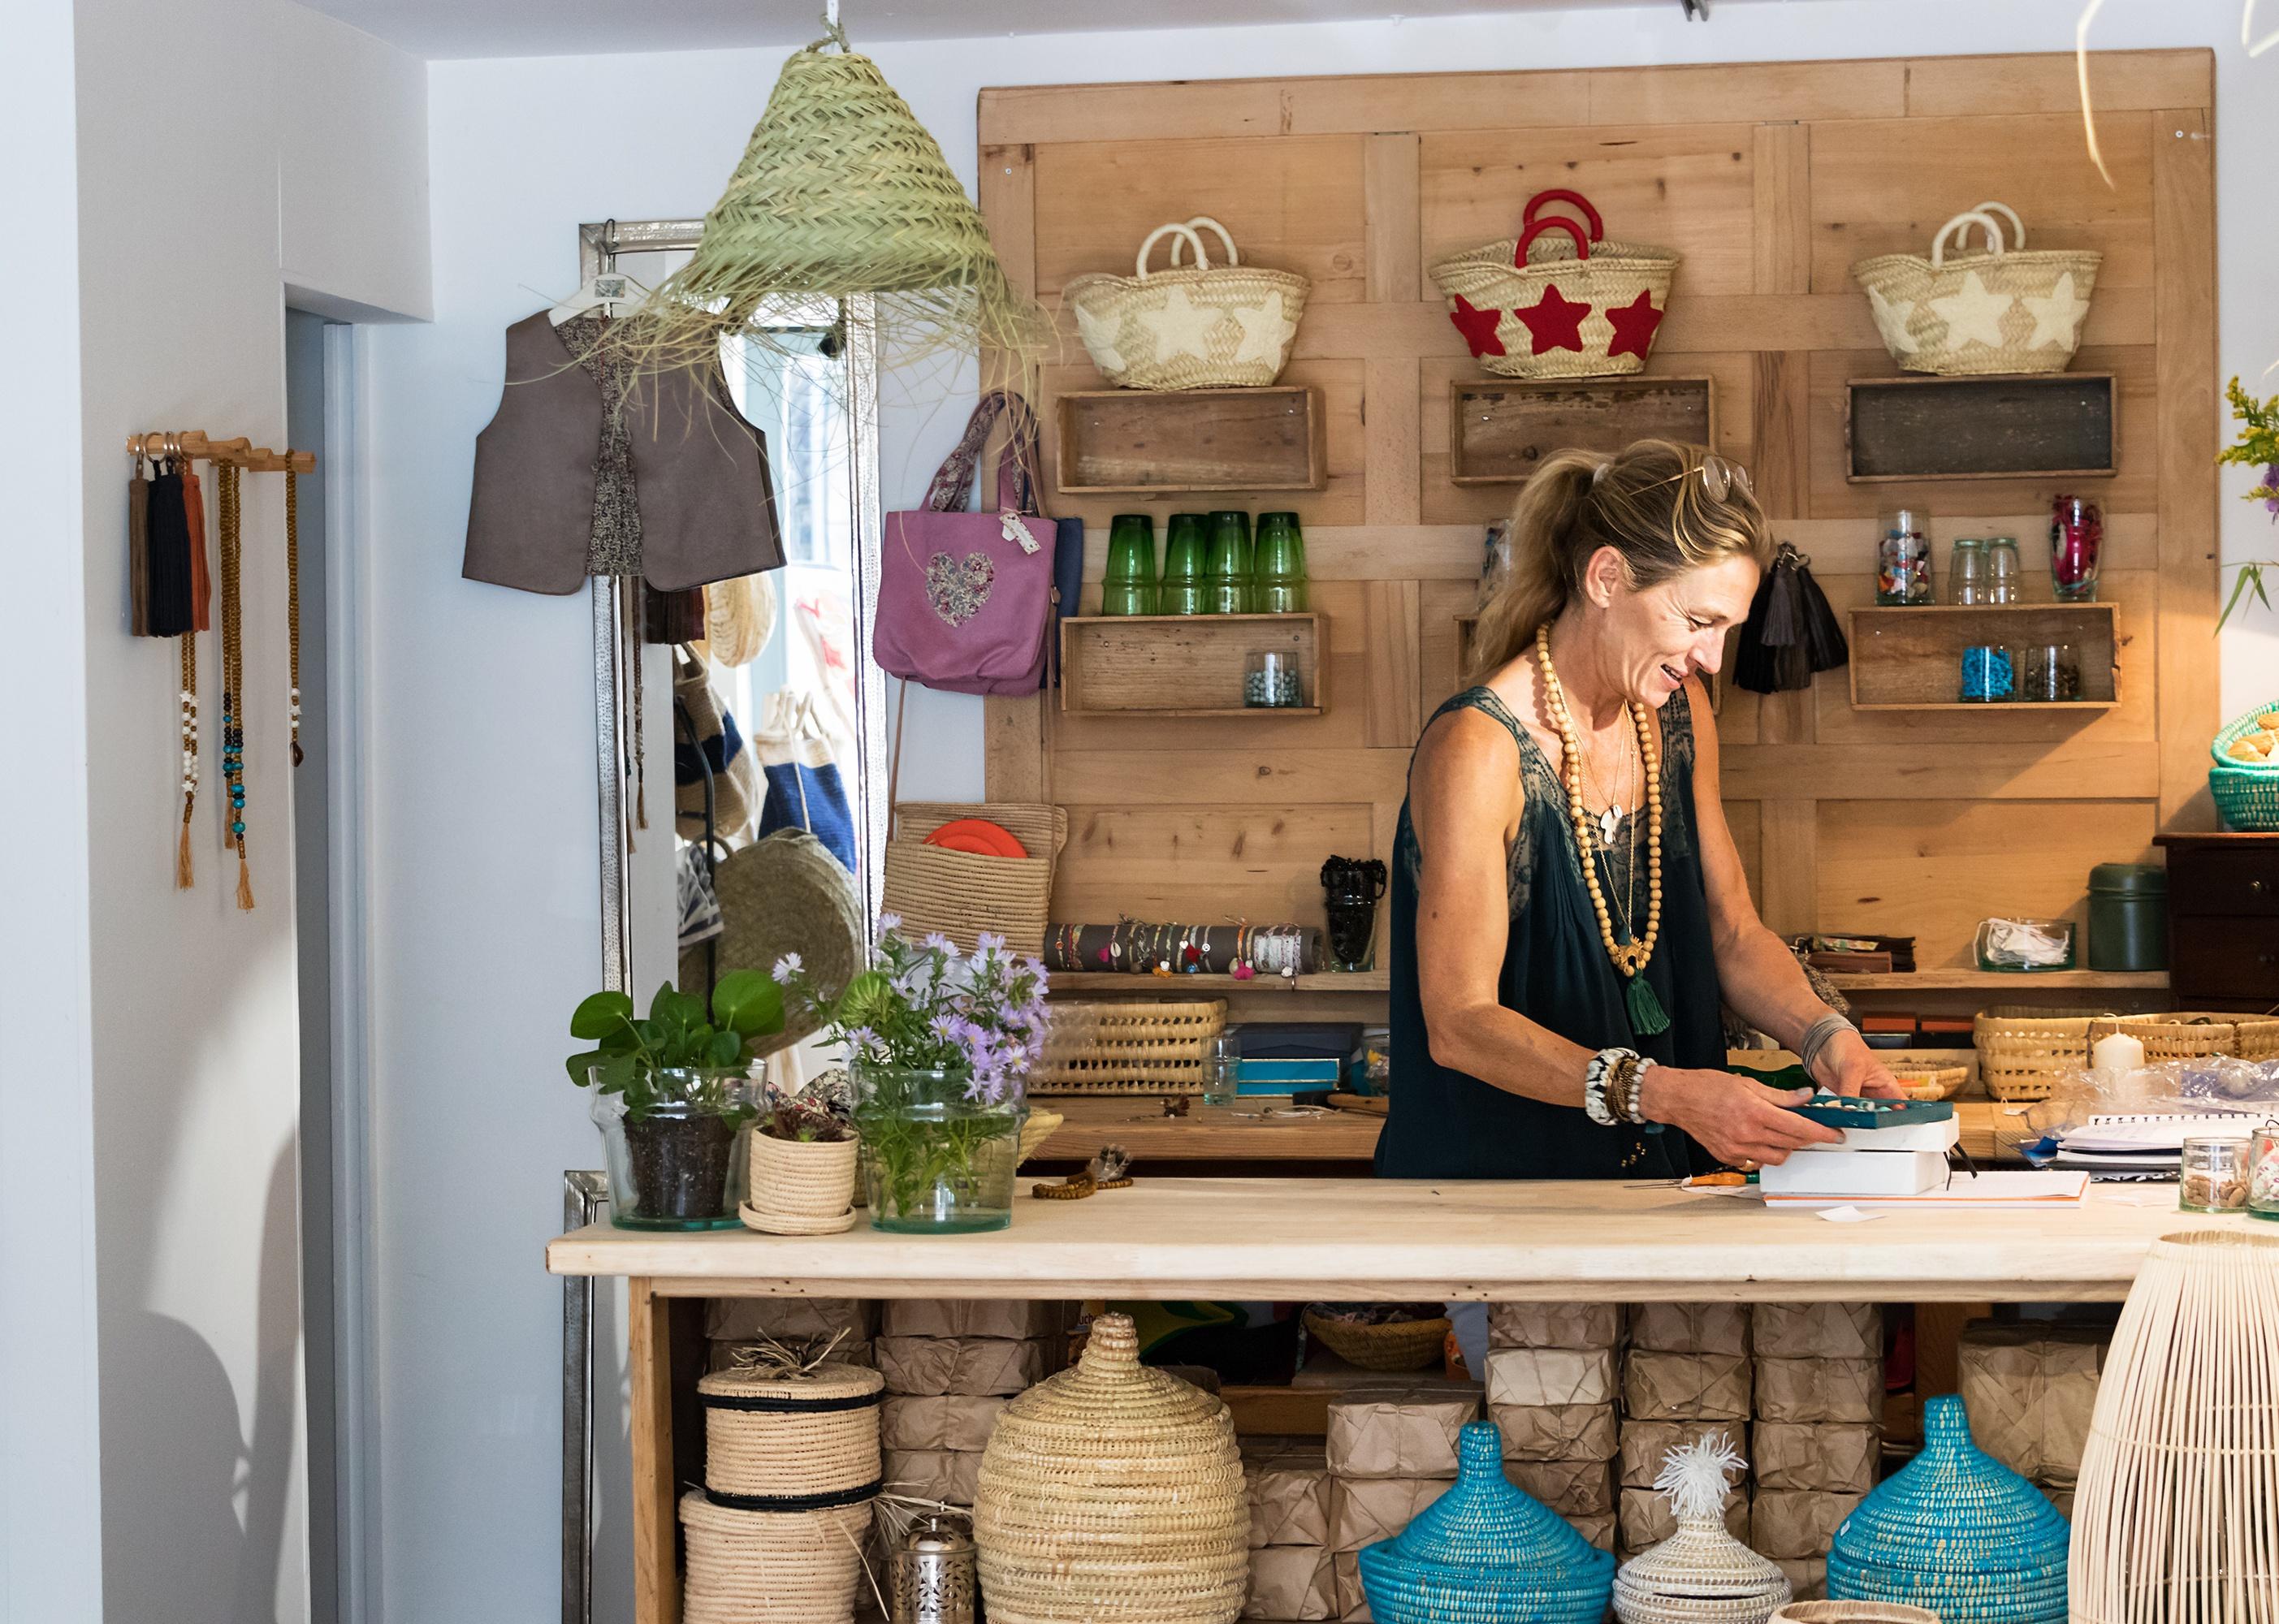
States with the highest rates of small business employment
Woman wearing an apron stands in front of work space holding boxes.
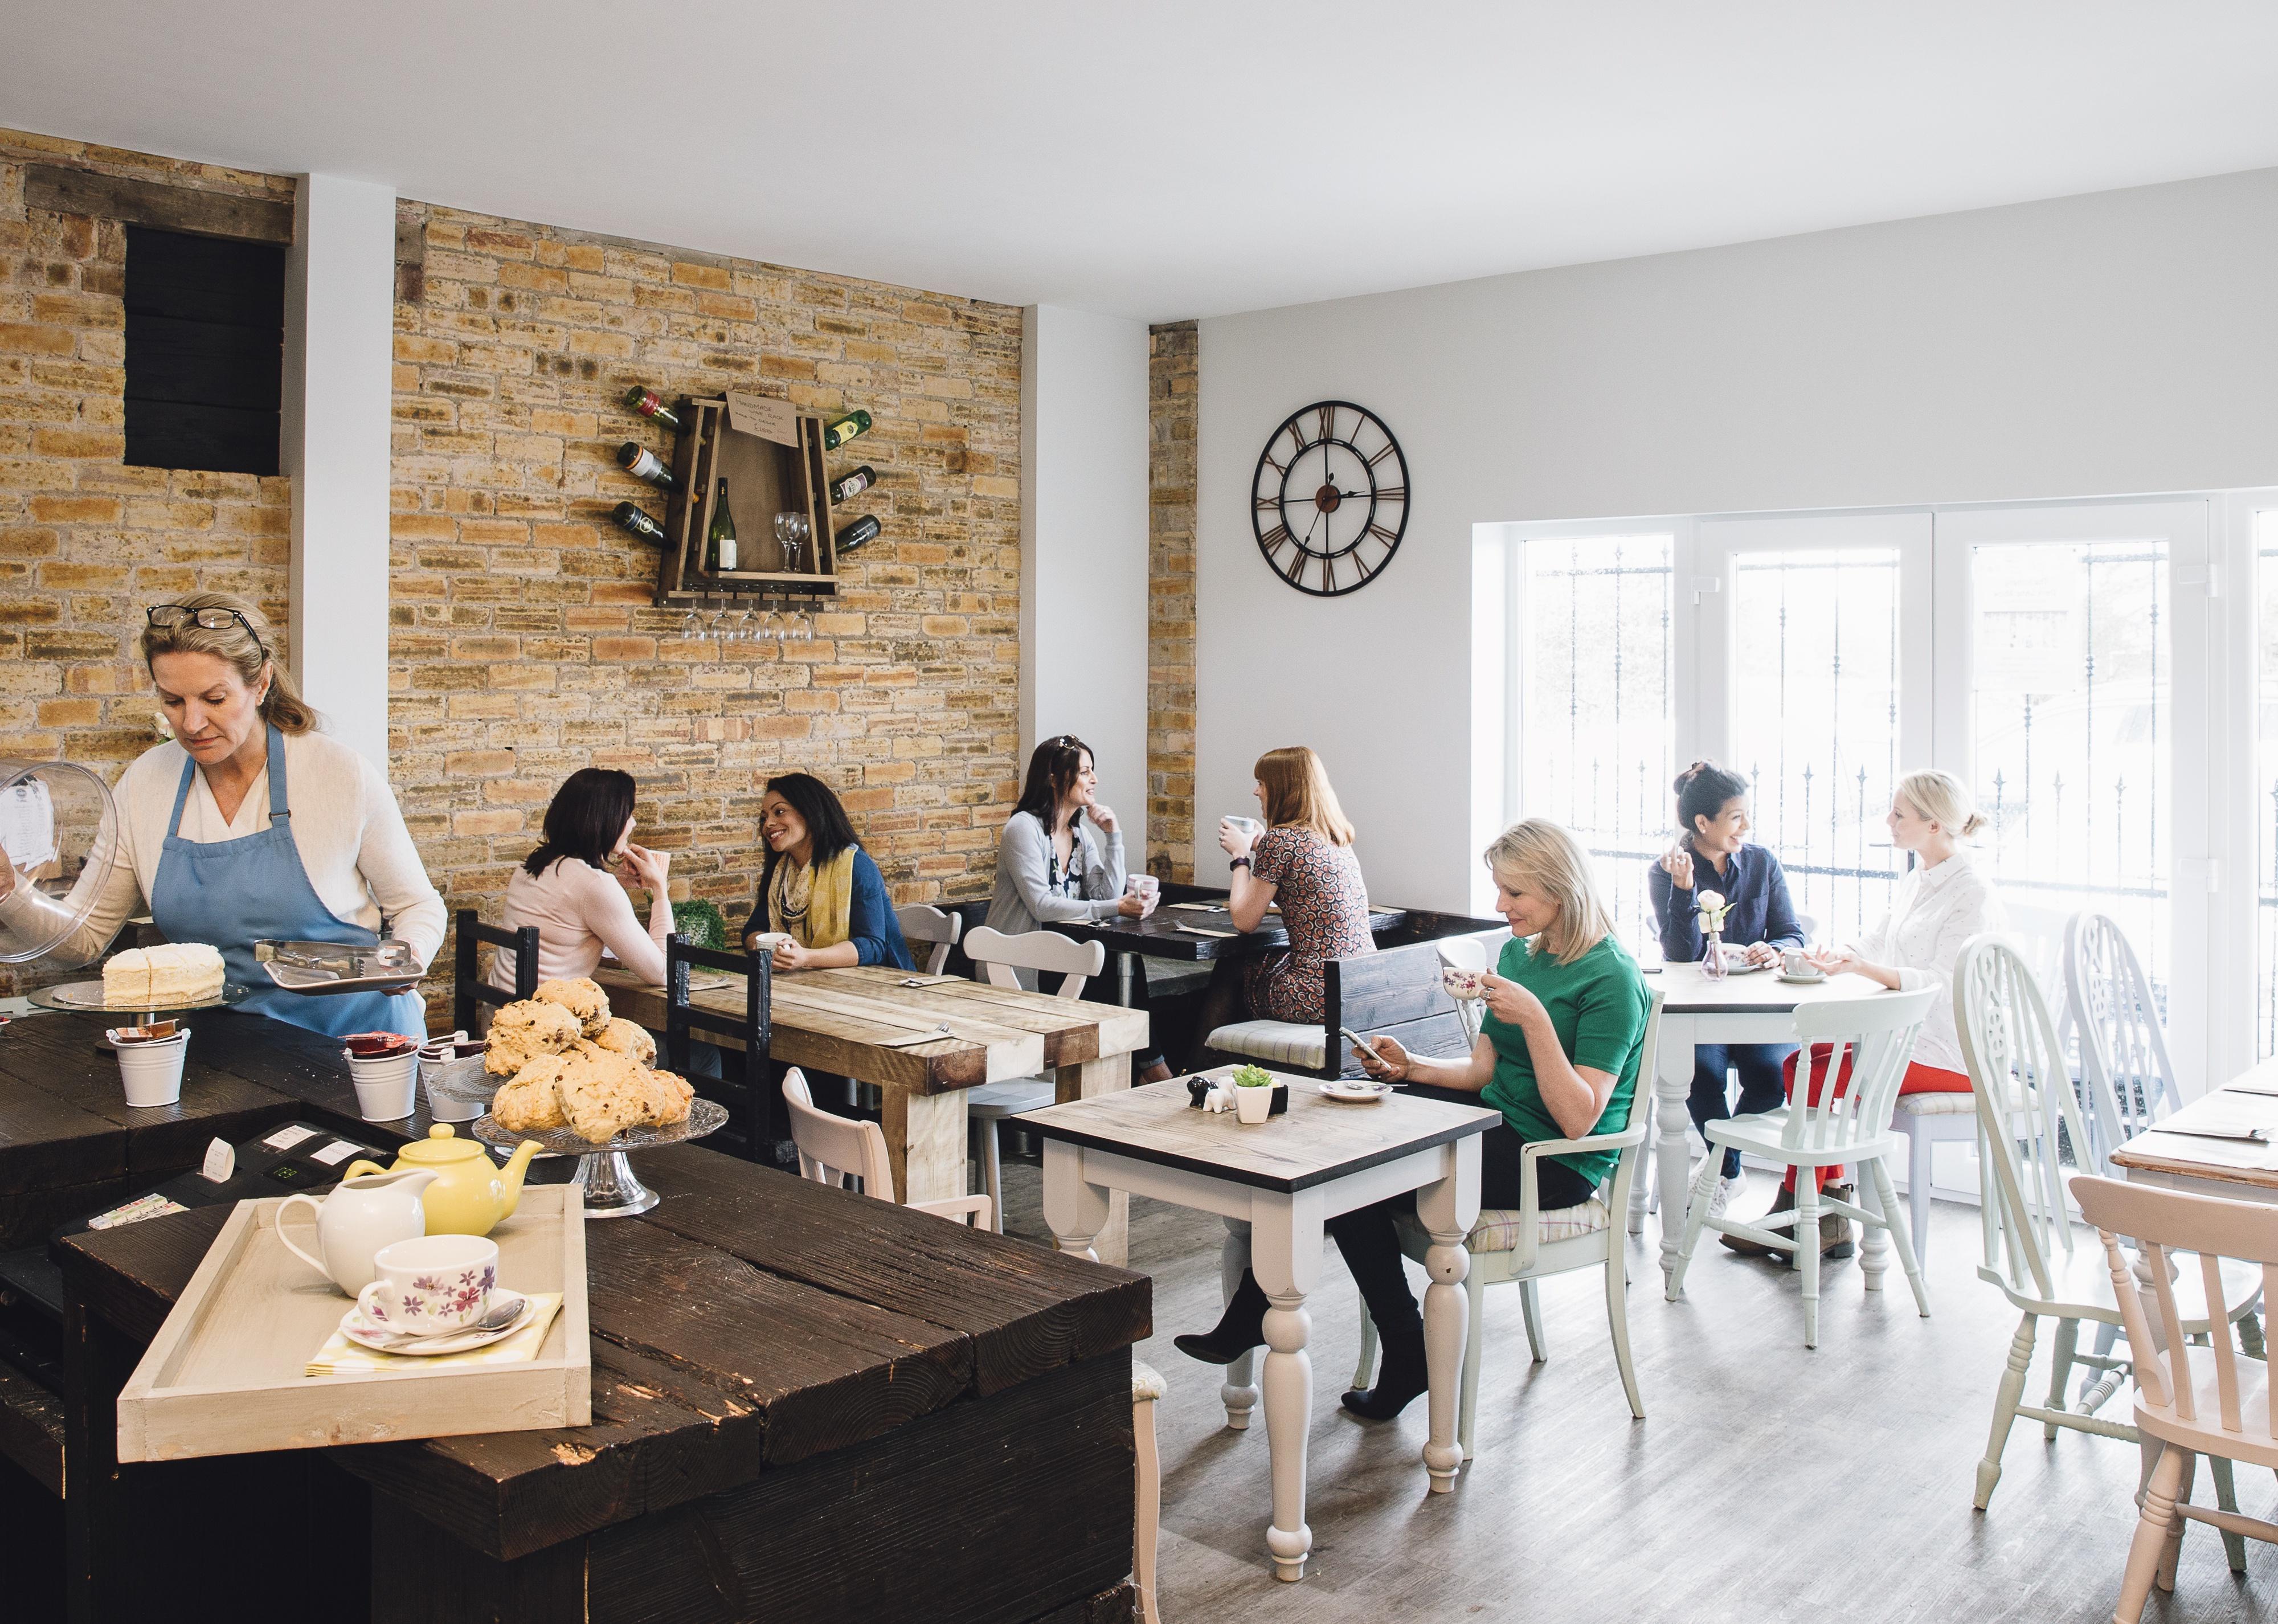
2021 was a record year for people deciding to work for themselves, with 5.4 million new business applications nationwide—and 2022 has followed close on its heels. Though not all companies will have employees, the surge could lead to a rise in small business jobs in years to come.
This analysis defines small businesses as having fewer than 500 employees, which comprise more than 99% of businesses nationwide. There were more than 6 million of them in the U.S. in 2019, the most recent year of the Census Bureau’s Statistics of U.S. Businesses. These small businesses employed about 61.7 million people—a little less than half of all private workers—and paid nearly $3 trillion in wages.
Swyft Filings used Census Bureau data to identify which states have the highest rates of small businesses employment. States are ranked by the percentage of employees who worked at small businesses in 2019. The data excludes nonemployer businesses, private households, railroads, agricultural production, and most government entities.
![]()
Swyft Filings
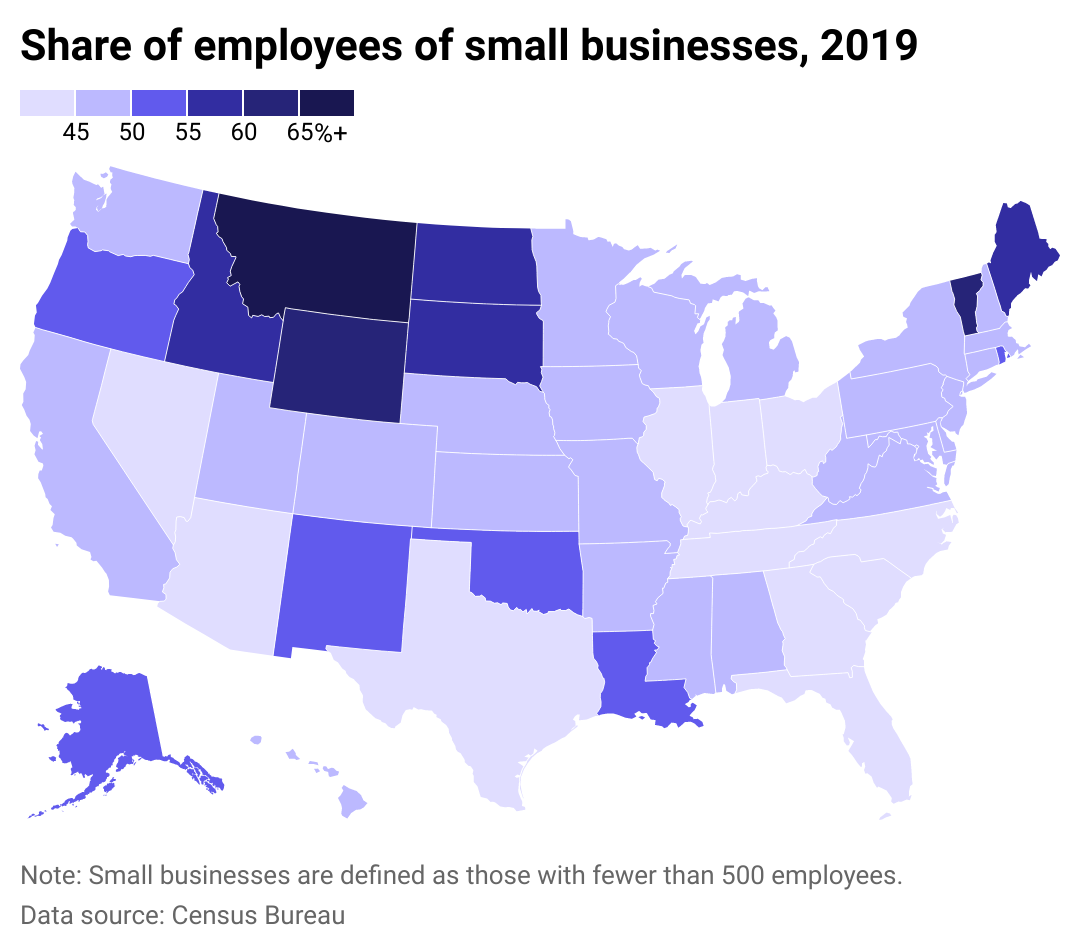
Small businesses employ less than half of the private workforce in most states
Heat map showing the share of private workers employed by small businesses in each state.
Nationally, 46% of employees worked for small businesses in 2019. Most states are close within that range, as well. But there are some notable exceptions.
In much of the northwest quadrant of the country, small companies held a larger share of total employees. Montana led the nation, with about 2 in 3 employees working for small bsuinesses—surpassing the national average by 20 percentage points. Leading small business industries for Montana and neighboring states include construction, professional/scientific/technical services, and real estate/leasing, according to the Small Business Association (SBA).
The relatively low cost of living in the Midwest and Mountain regions means small businesses can afford to employ more people than in states with higher living expenses or where they have to compete with larger, high-paying corporations. Montana’s companies benefit from its quality-of-life characteristics, such as work-life balance, outdoor activities, and the landscape’s natural beauty, according to a Montana High Tech Business Alliance survey.
Vermont and Maine also stood out, particularly within the Northeast. Again, the largest industries for small businesses were construction and professional/scientific/technical services, according to the SBA. Most Vermont small businesses are sole proprietorships or unincorporated businesses with a single owner who may or may not have employees.
Swyft Filings
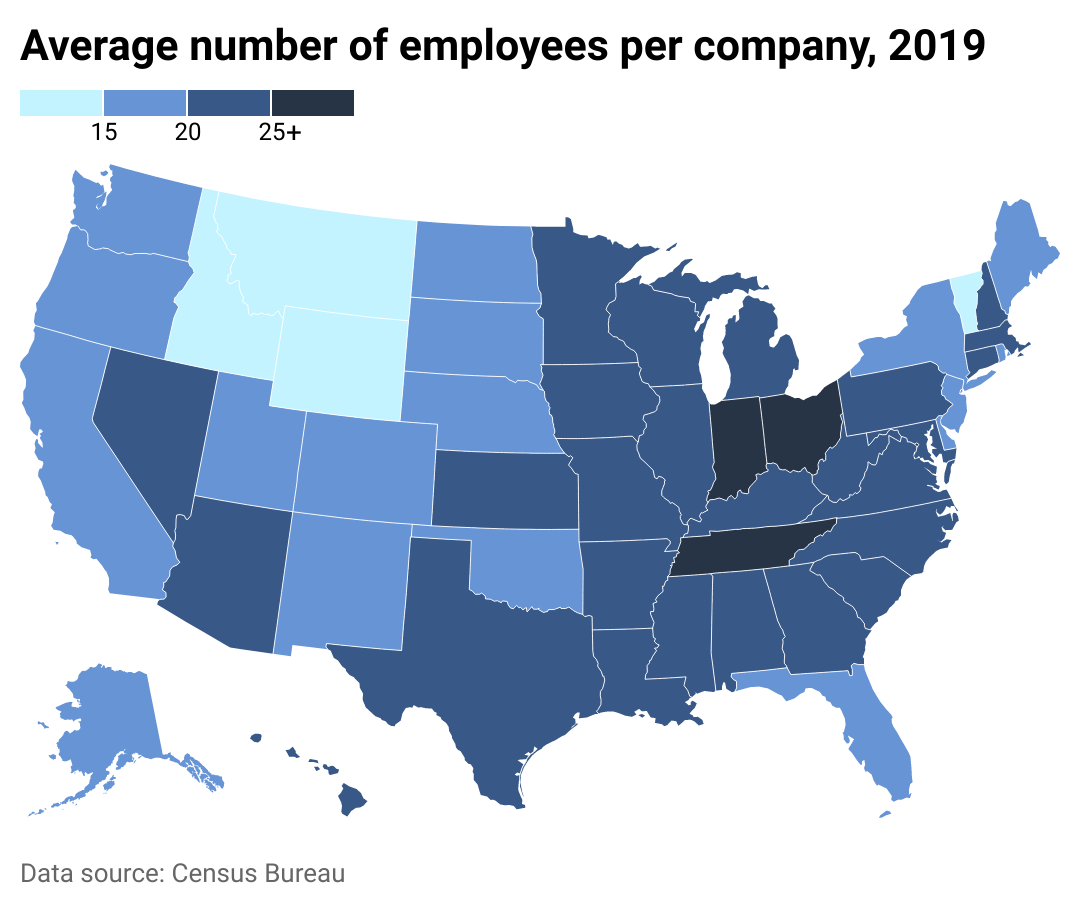
US averages about 22 employees per business
Heat map showing the average number of private workers in each state.
Small businesses have 500 employees or less, but most are considerably smaller. Nearly 9 in 10 of all U.S. companies have fewer than 20 employees. On average, U.S. companies have about 22 employees.
The highest statewide average employment per business is 28 in Washington D.C. Again, the northern Mountain region maintains the lowest averages, namely in Montana, Idaho, and Wyoming, with Vermont following closely behind.
Swyft Filings
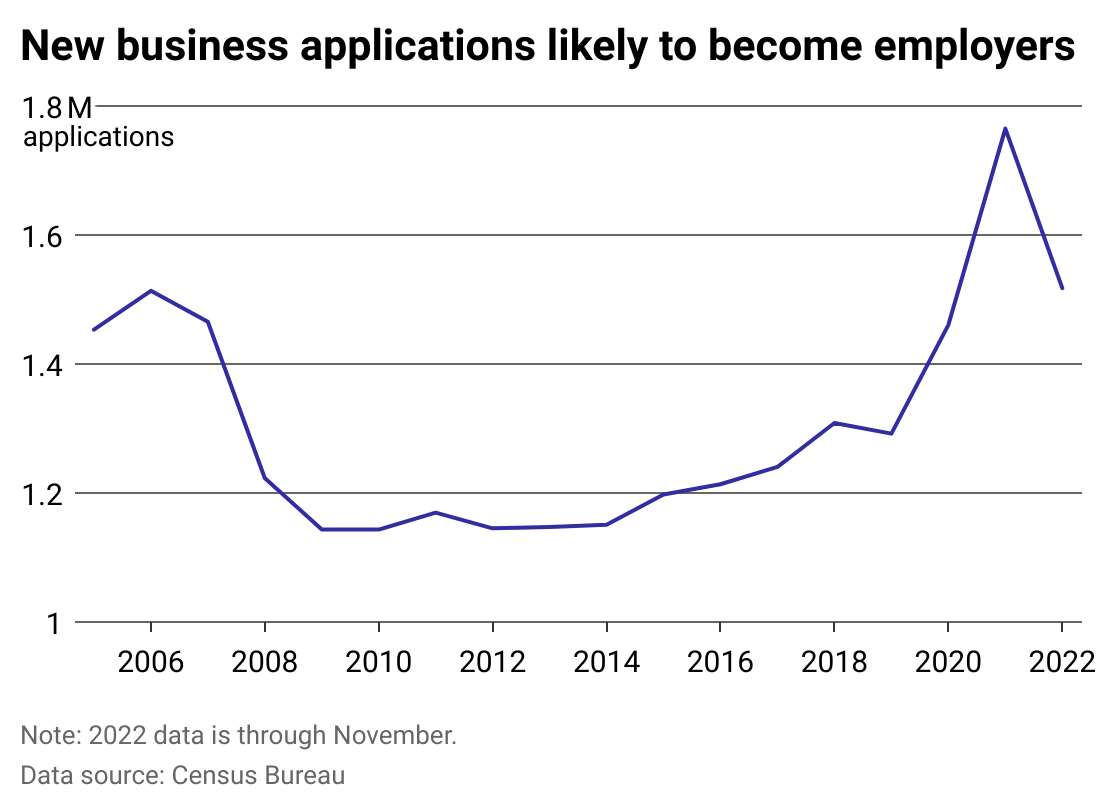
Business applications, including probable employers, surged in 2021
Line chart showing the number of new business applications likely to become employers by year.
Of the 5.4 million business applications in 2021, nearly 1.8 million were likely employers. That’s more than any single year in the past 15 years. Through November 2022, about 1.5 million more applications were deemed likely to become employers.
The Census uses a variety of factors to determine likely employers (formally called high-propensity business applications). Considerations include whether an application comes from an existing corporate entity, whether it indicates a hiring plan or planned wages, and if it’s within a handful of industries that typically go on to employ others, such as accommodation, food services, manufacturing, or retail.
Startups are critical to innovation, job creation, and productivity. Though applications—likely employers or not—won’t all materialize into companies, historically, startup activity has followed business application trends fairly closely. There’s a good chance more companies, and in turn, small business jobs, will continue to grow in the months and years to come.
DNV // Shutterstock
#51. Florida
Small bait shop in Florida.
– Share of workers employed by small businesses: 40.5% (3.6 million)
– Share of businesses that are small: 98.9% (465,494)
– Annual payroll of small businesses: $154.9B (36.3% of state’s private payroll)
– 2022 small business applications through November: 558,818 (34.3% likely to become employers)

Ground Picture // Shutterstock
#50. Tennessee
Closeup hands of two people calculating bills and expenses.
– Share of workers employed by small businesses: 42.2% (1.2 million)
– Share of businesses that are small: 96.5% (97,229)
– Annual payroll of small businesses: $49.0B (37.7% of state’s private payroll)
– 2022 small business applications through November: 84,415 (33.1% likely to become employers)

Diego Cervo // Shutterstock
#48. Arizona (tie)
Grandparent with grandchild in a lute maker shop.
– Share of workers employed by small businesses: 42.5% (1.1 million)
– Share of businesses that are small: 97.0% (110,403)
– Annual payroll of small businesses: $48.2B (37.2% of state’s private payroll)
– 2022 small business applications through November: 105,966 (29.7% likely to become employers)

Monkey Business Images // Shutterstock
#48. Georgia (tie)
Craftsperson in carpentry workshop.
– Share of workers employed by small businesses: 42.5% (1.7 million)
– Share of businesses that are small: 97.6% (181,536)
– Annual payroll of small businesses: $76.3B (35.9% of state’s private payroll)
– 2022 small business applications through November: 252,191 (27.7% likely to become employers)

Ground Picture // Shutterstock
#47. Nevada
Smiling florist holding card reader machine with customer paying with credit card.
– Share of workers employed by small businesses: 42.8% (540,004)
– Share of businesses that are small: 95.6% (52,368)
– Annual payroll of small businesses: $23.5B (40.4% of state’s private payroll)
– 2022 small business applications through November: 57,290 (28.5% likely to become employers)
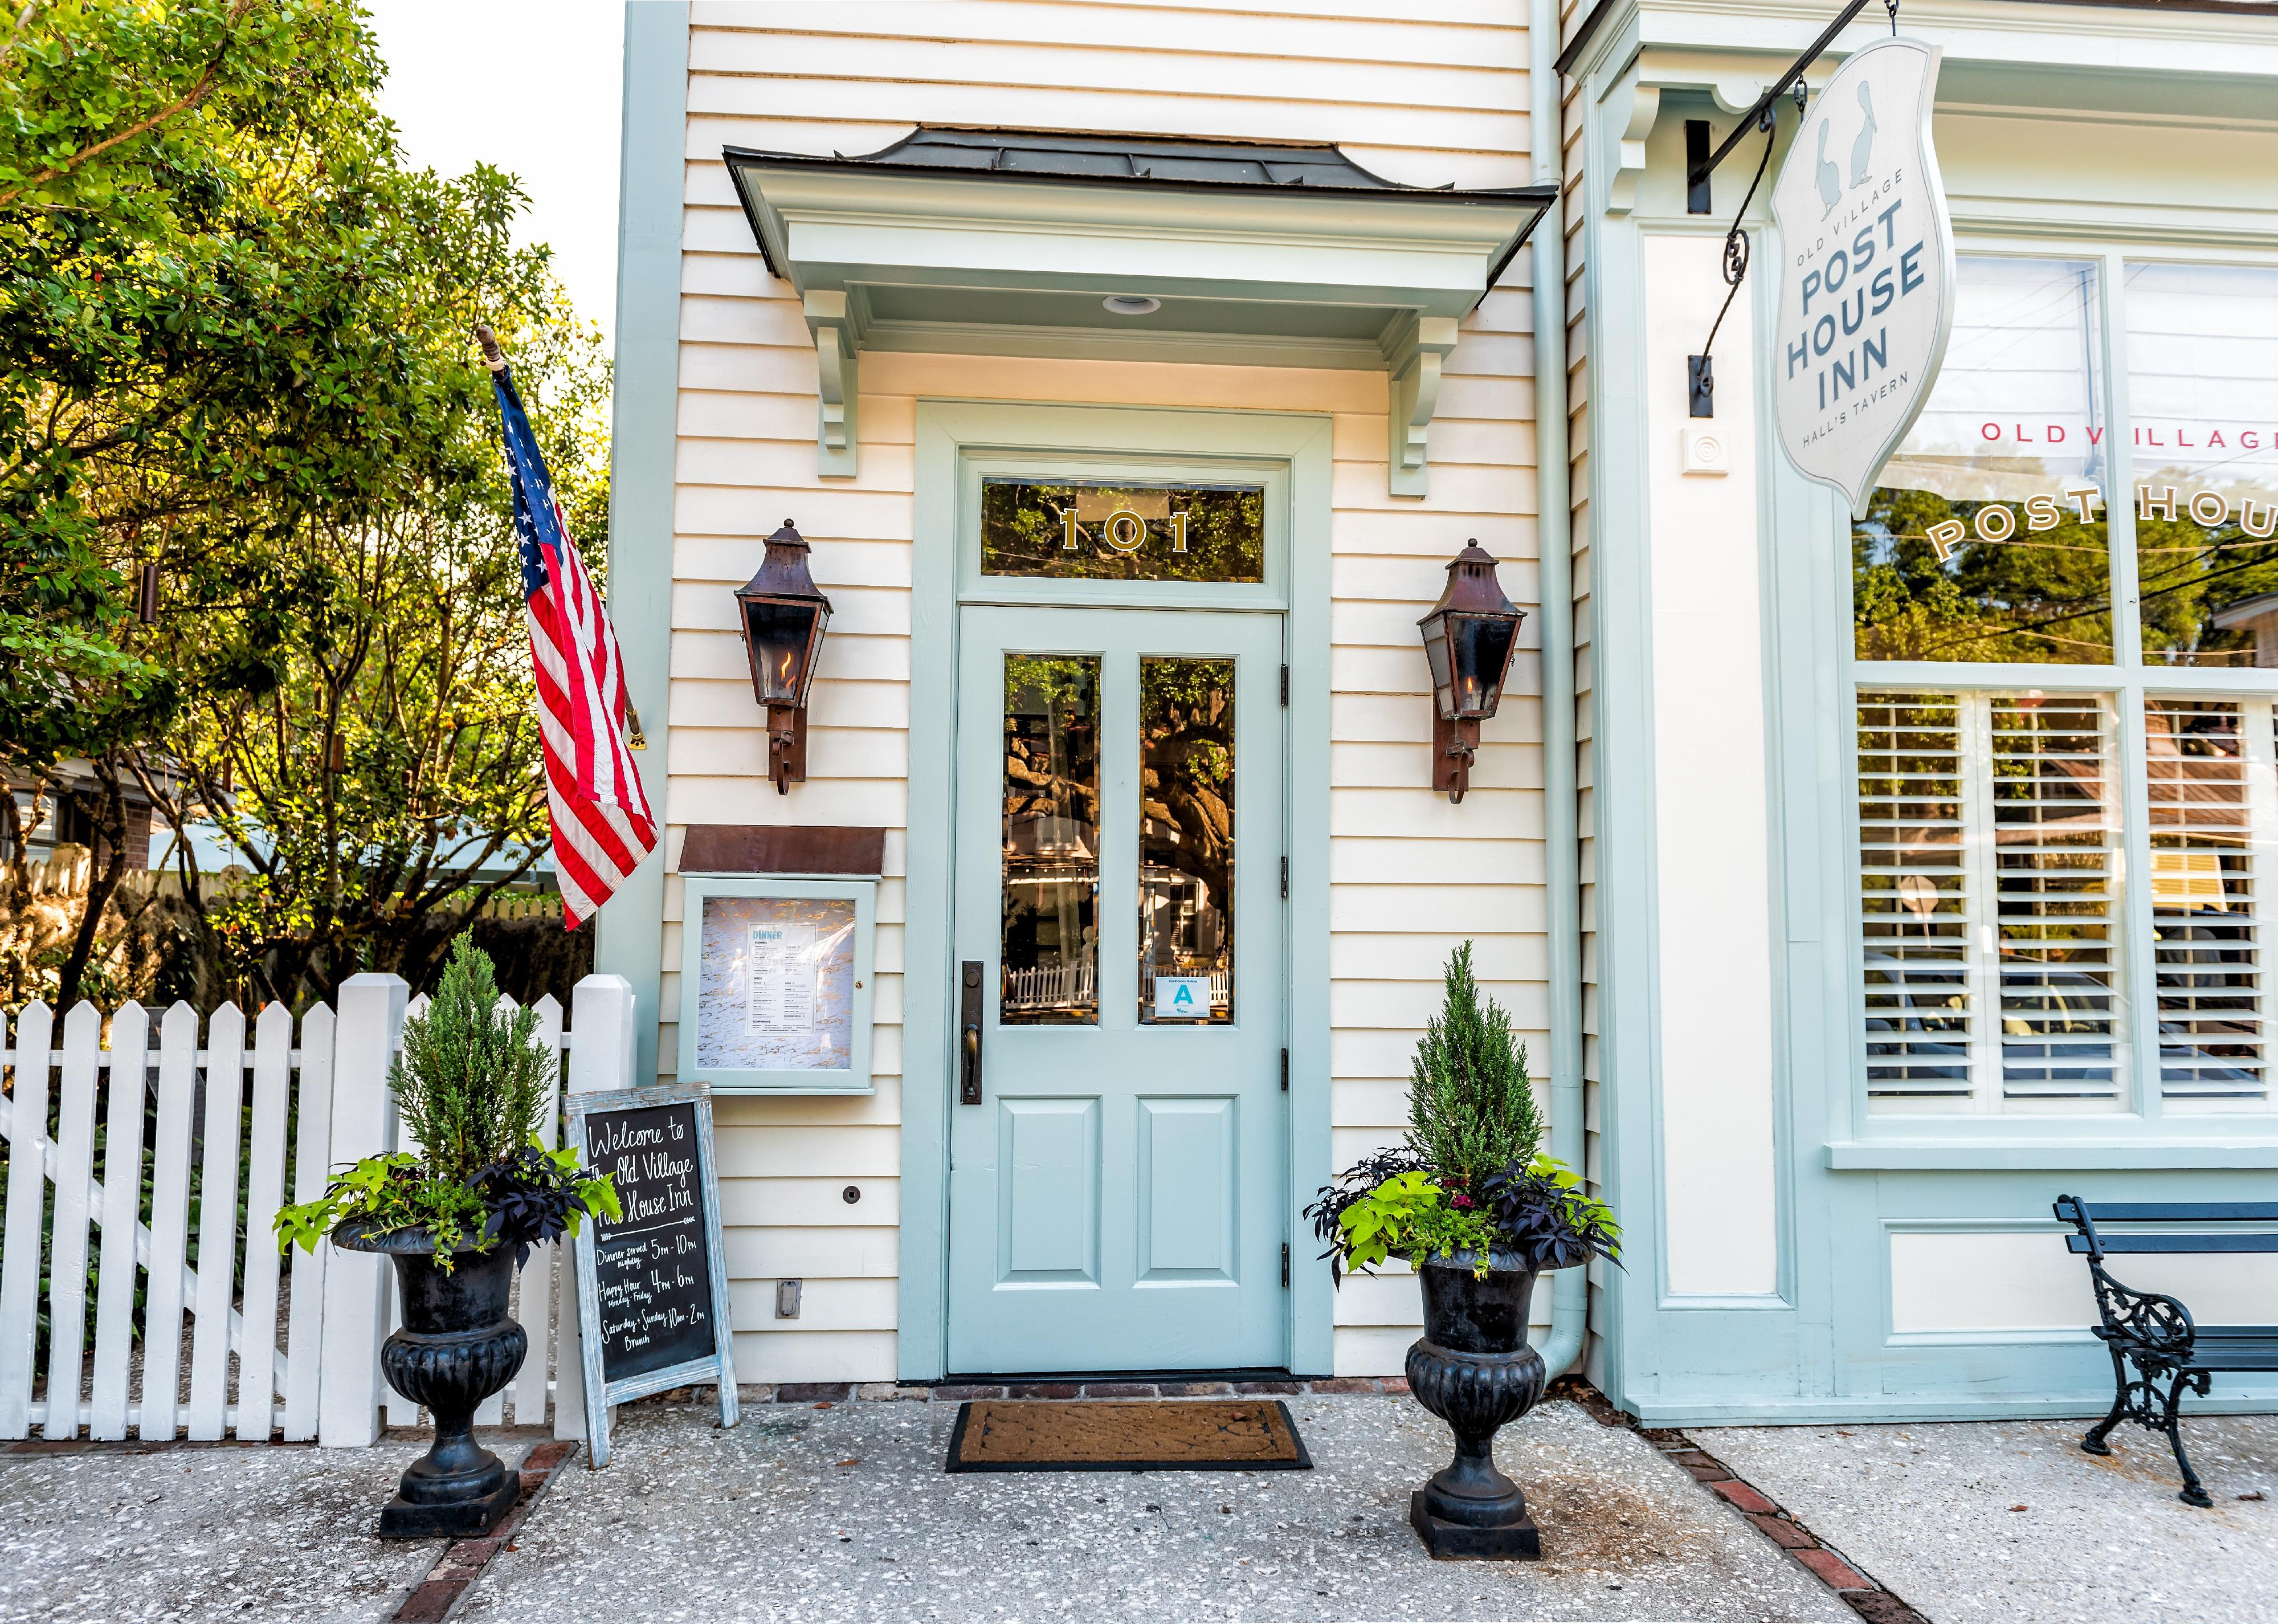
Kristi Blokhin // Shutterstock
#46. South Carolina
Entrance to a small inn in Charleston.
– Share of workers employed by small businesses: 43.0% (837,615)
– Share of businesses that are small: 96.7% (82,820)
– Annual payroll of small businesses: $32.2B (38.6% of state’s private payroll)
– 2022 small business applications through November: 83,645 (26.6% likely to become employers)
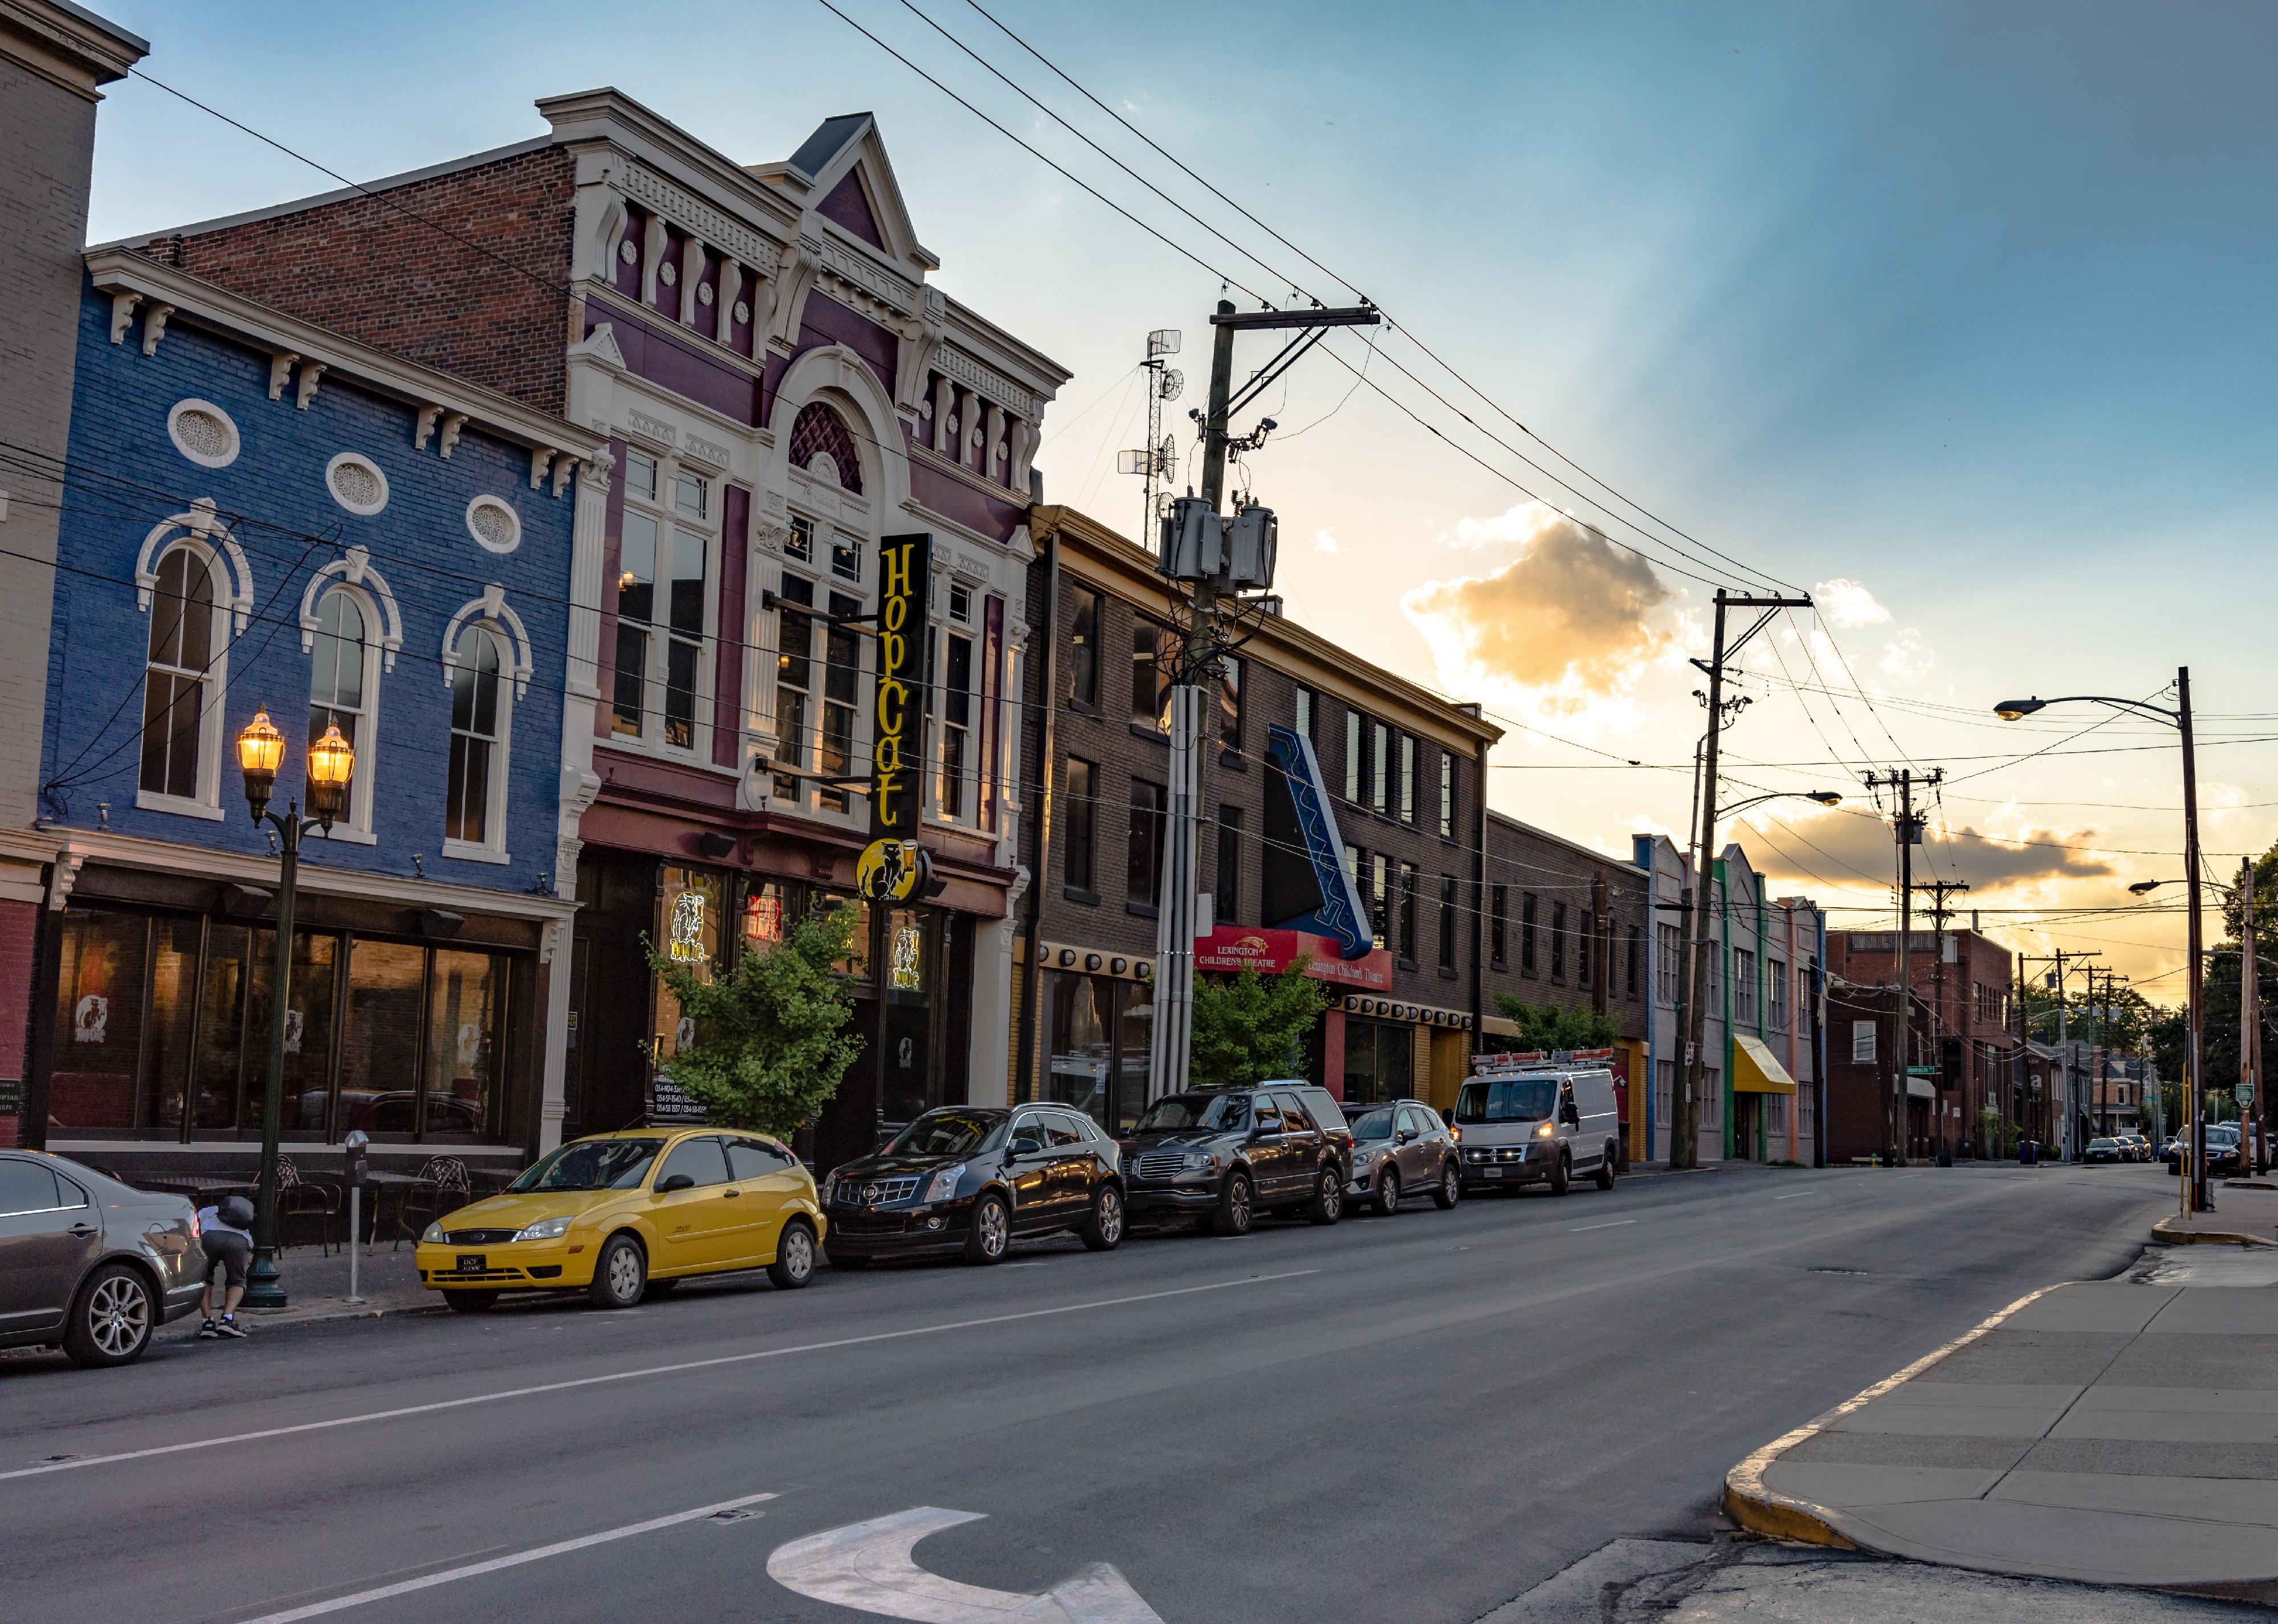
JNix // Shutterstock
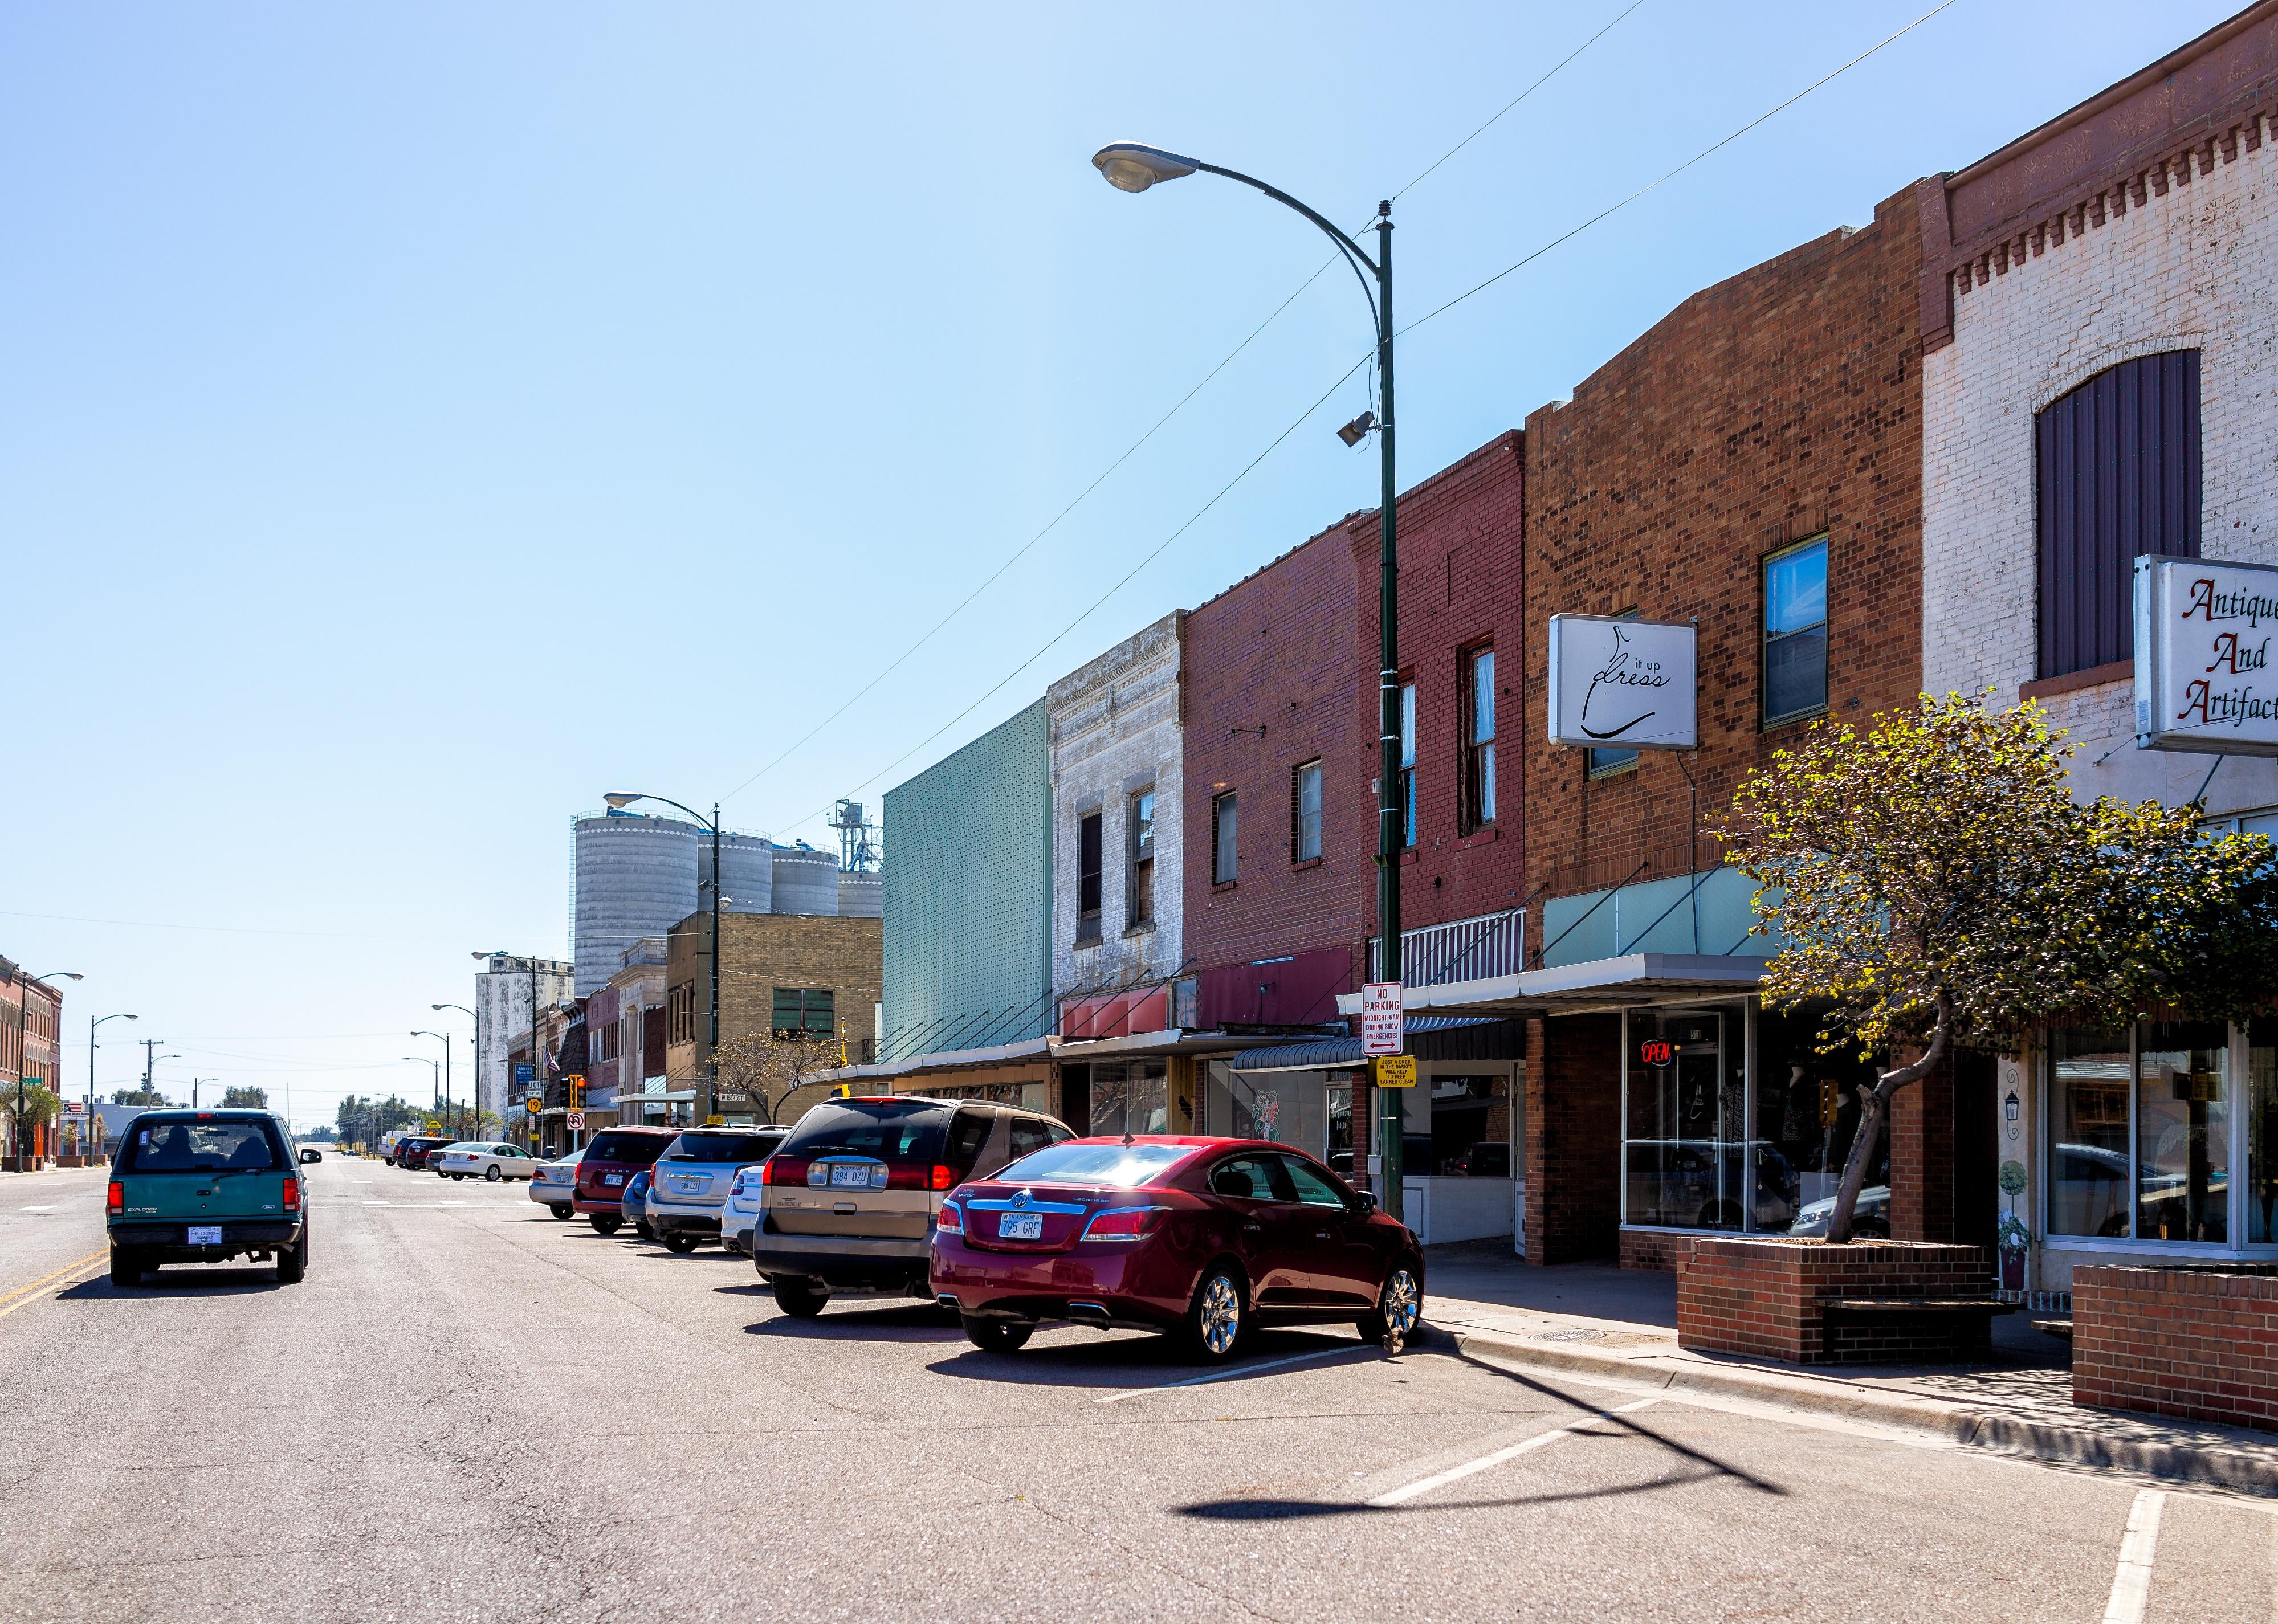
#45. Kentucky
Lexington small businesses on street.
– Share of workers employed by small businesses: 43.3% (722,253)
– Share of businesses that are small: 96.1% (64,723)
– Annual payroll of small businesses: $27.9B (37.2% of state’s private payroll)
– 2022 small business applications through November: 42,973 (29.7% likely to become employers)
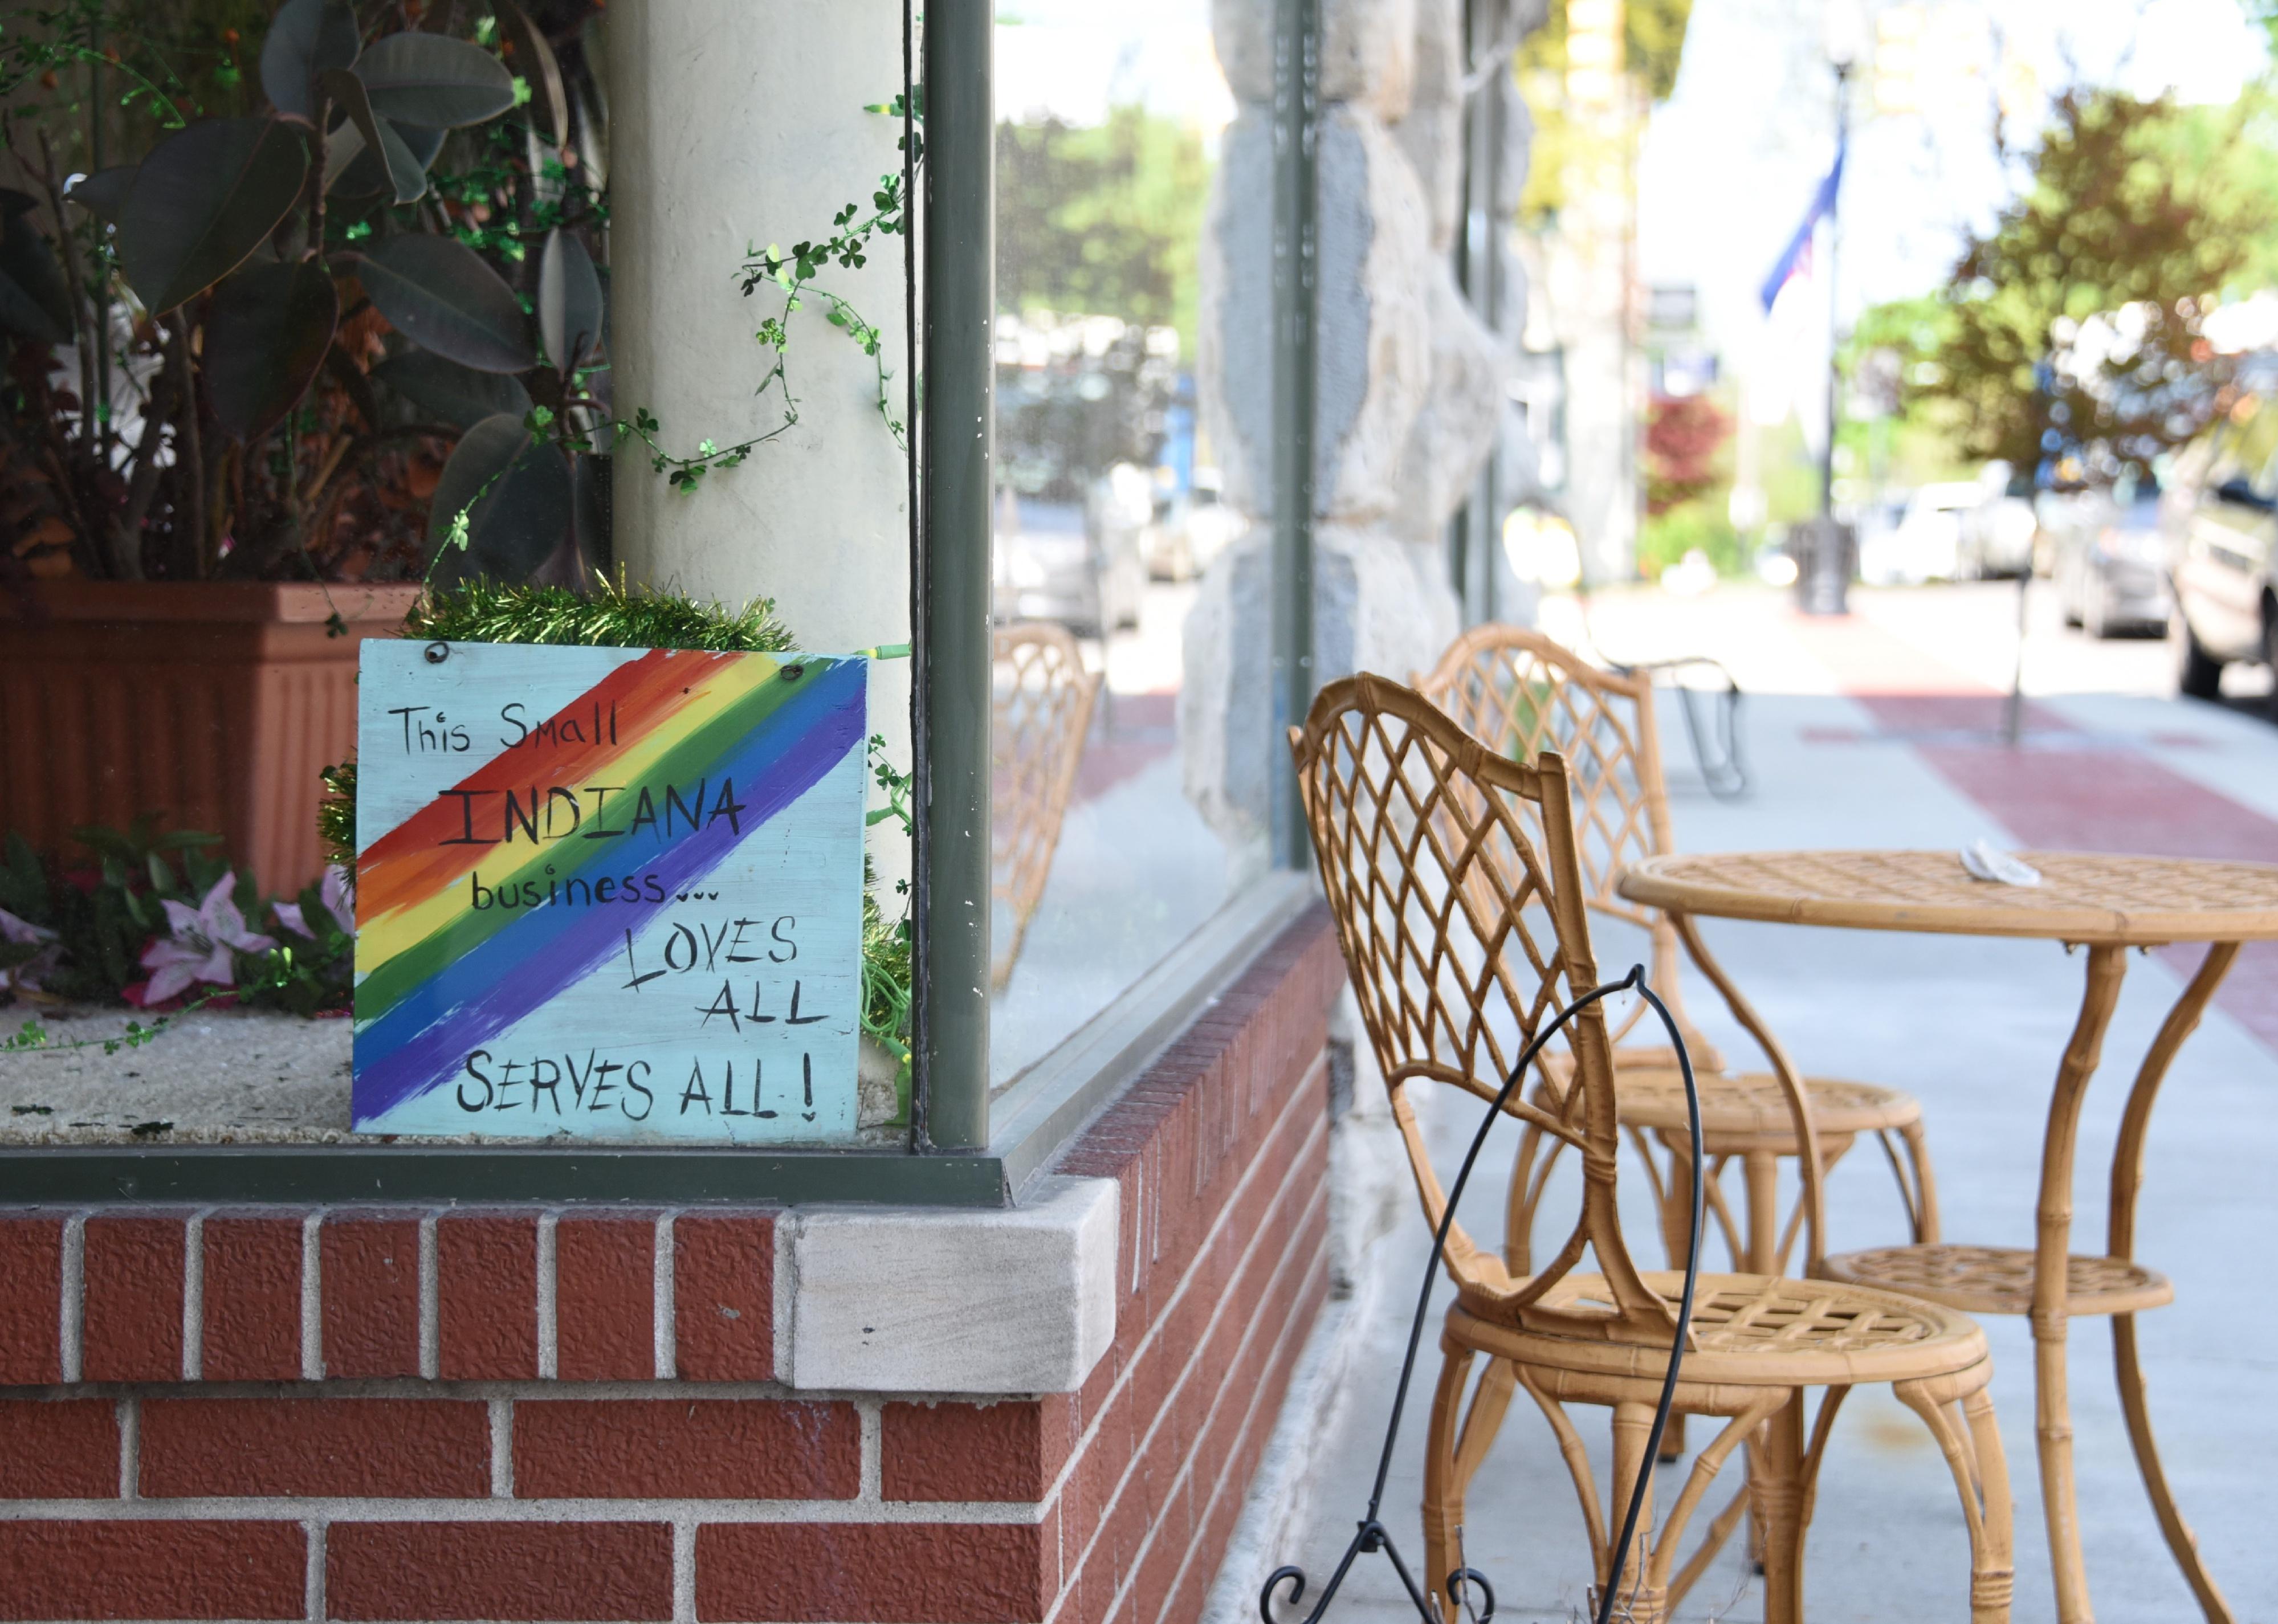
DianeGiangrossi // Shutterstock
#44. Indiana
Small business with sign that everyone is welcome.
– Share of workers employed by small businesses: 43.8% (1.2 million)
– Share of businesses that are small: 96.9% (106,588)
– Annual payroll of small businesses: $50.6B (38.2% of state’s private payroll)
– 2022 small business applications through November: 76,795 (30.5% likely to become employers)

mavo // Shutterstock
#43. North Carolina
Business owner of a coffee roaster checking their laptop.
– Share of workers employed by small businesses: 44.4% (1.7 million)
– Share of businesses that are small: 97.8% (178,487)
– Annual payroll of small businesses: $71.7B (36.8% of state’s private payroll)
– 2022 small business applications through November: 150,702 (30.4% likely to become employers)

Follow Focus // Shutterstock
#42. Texas
Store owner turning open sign through the door glass.
– Share of workers employed by small businesses: 44.5% (4.9 million)
– Share of businesses that are small: 98.6% (452,239)
– Annual payroll of small businesses: $233.3B (38.2% of state’s private payroll)
– 2022 small business applications through November: 428,385 (30.7% likely to become employers)
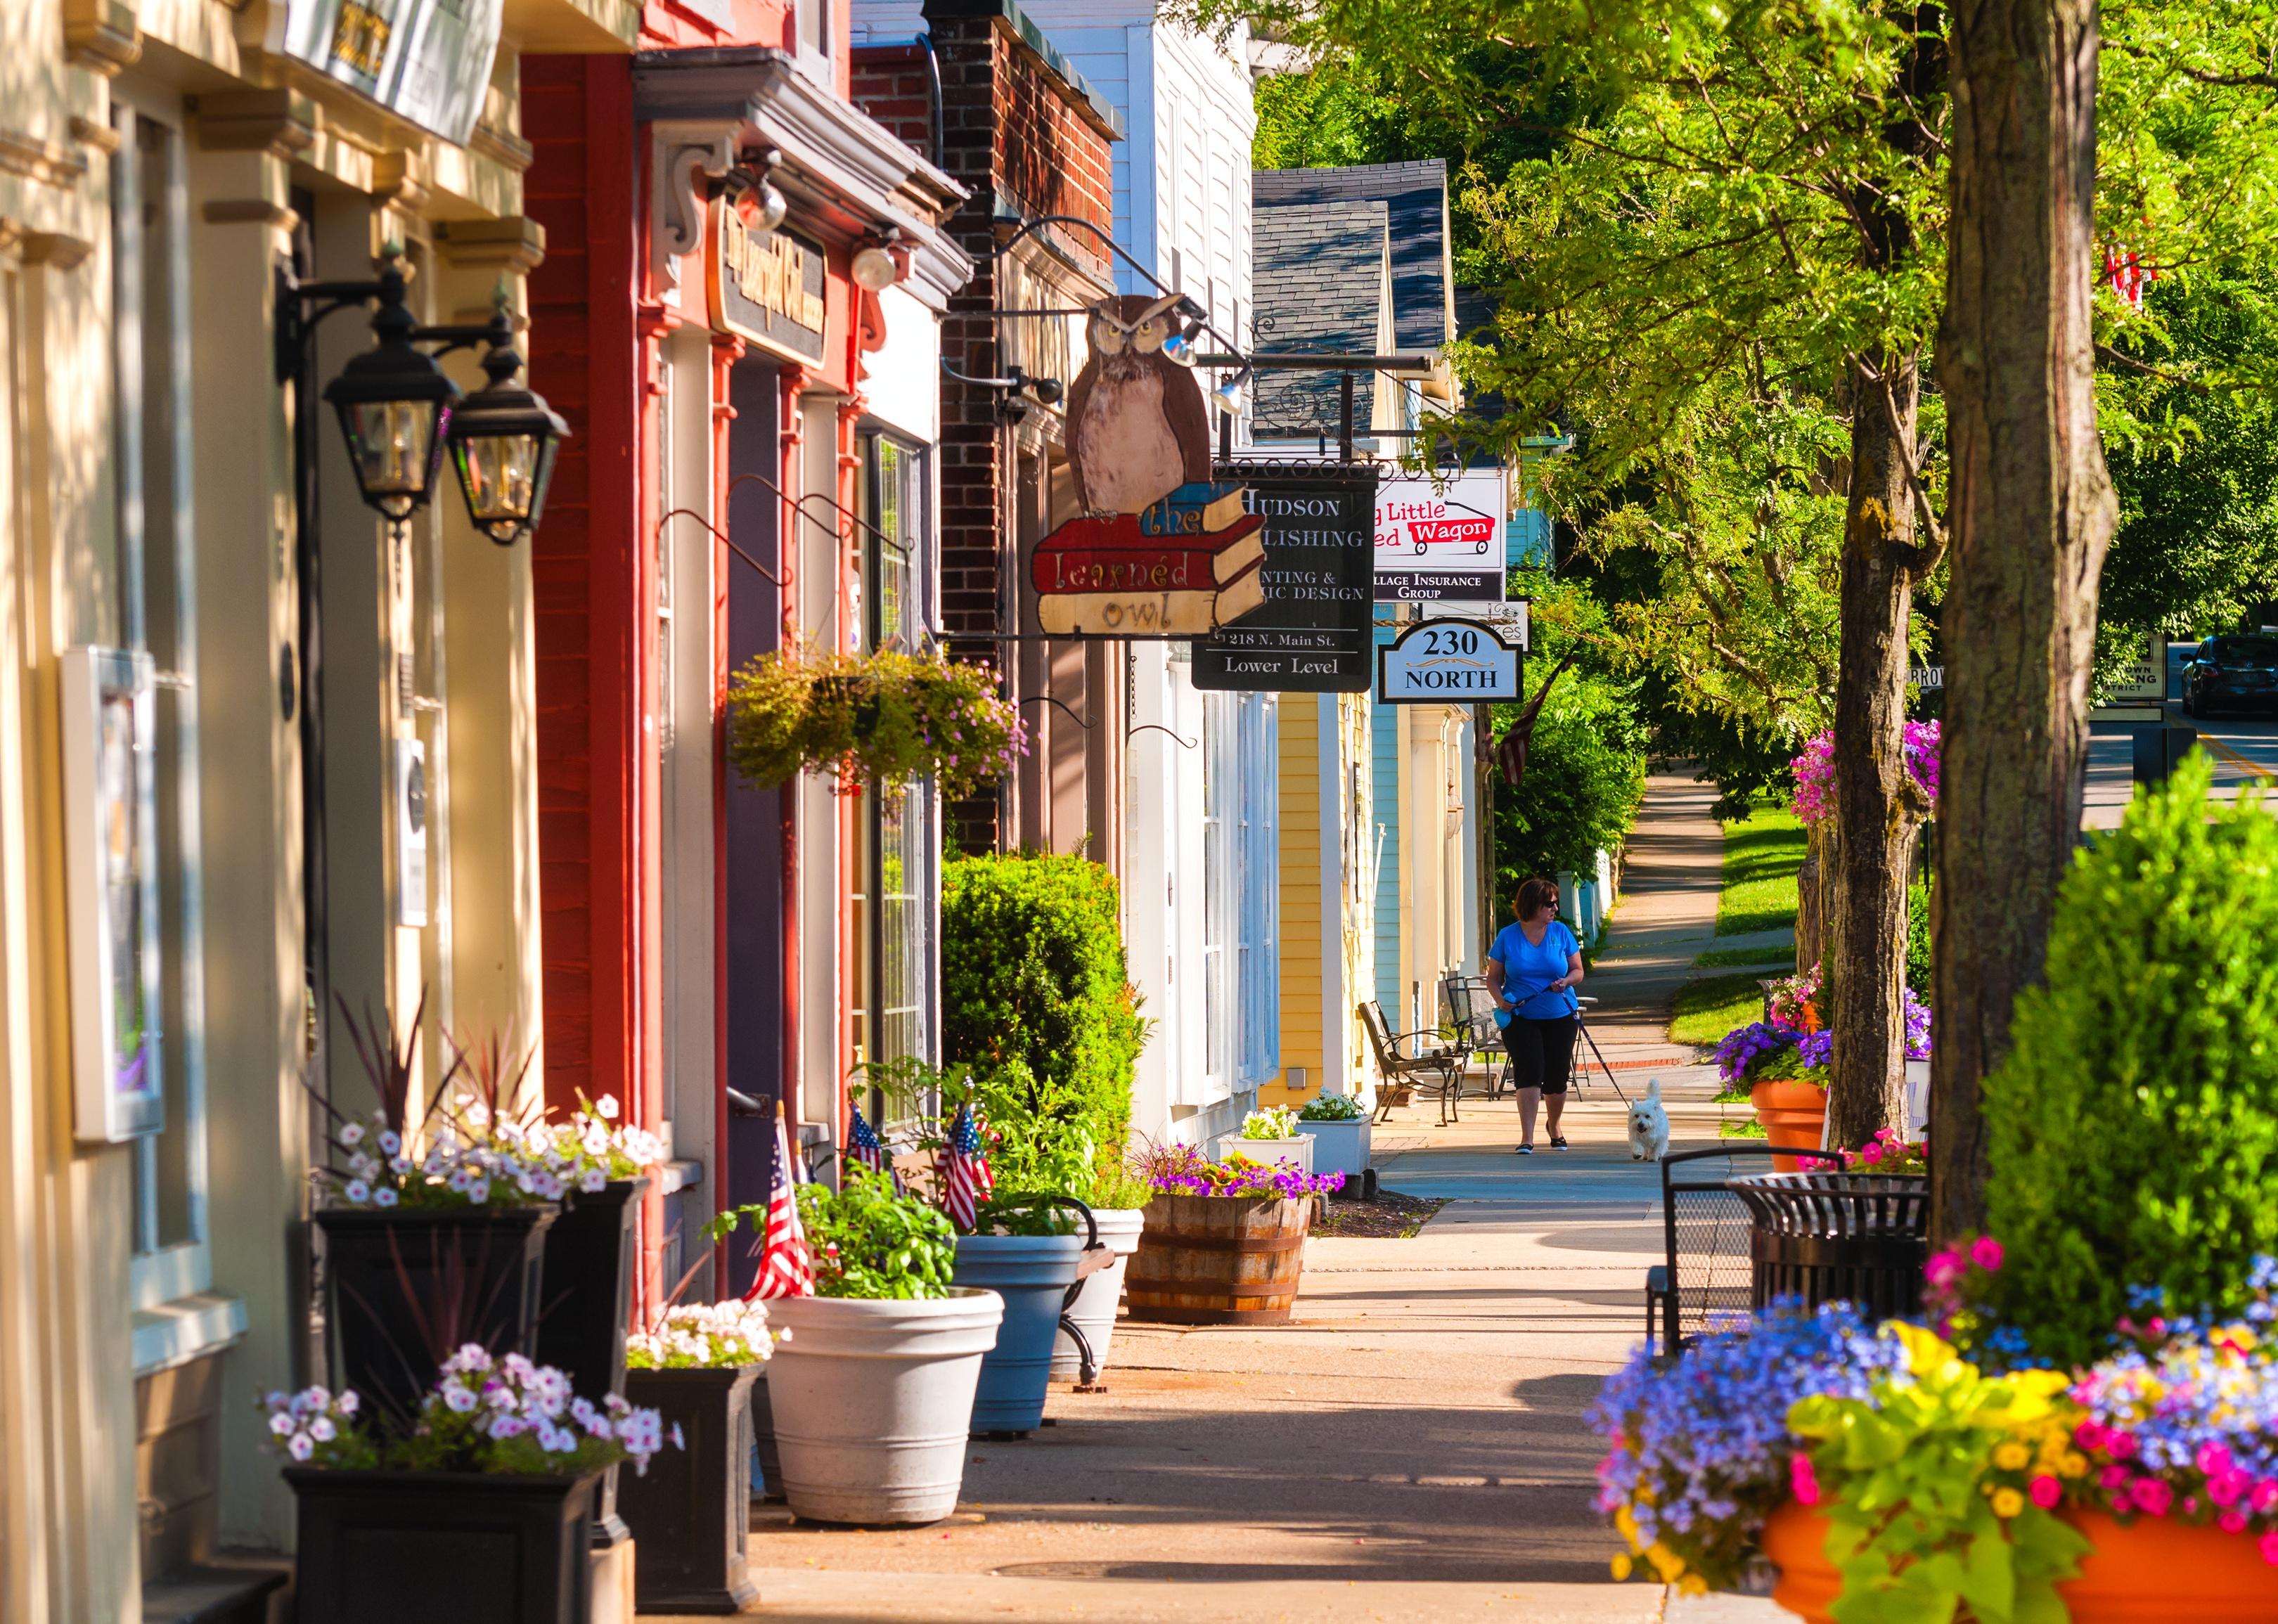
Kenneth Sponsler // Shutterstock
#40. Ohio (tie)
Quaint shops and businesses in Hudson, Ohio.
– Share of workers employed by small businesses: 44.7% (2.2 million)
– Share of businesses that are small: 97.7% (179,051)
– Annual payroll of small businesses: $93.7B (38.4% of state’s private payroll)
– 2022 small business applications through November: 129,404 (27.6% likely to become employers)

mavo // Shutterstock
#40. Illinois (tie)
A carpenter taking measurements for a frame.
– Share of workers employed by small businesses: 44.7% (2.5 million)
– Share of businesses that are small: 98.1% (251,107)
– Annual payroll of small businesses: $126.9B (39.0% of state’s private payroll)
– 2022 small business applications through November: 156,745 (36.8% likely to become employers)

Odua Images // Shutterstock
#39. Missouri
Shop owner takes notes with a pen while using a digital tablet.
– Share of workers employed by small businesses: 45.3% (1.2 million)
– Share of businesses that are small: 97.3% (113,475)
– Annual payroll of small businesses: $47.4B (37.8% of state’s private payroll)
– 2022 small business applications through November: 74,692 (29.3% likely to become employers)

G-Stock Studio // Shutterstock
#38. Massachusetts
Young adult working on sketches while standing in a studio.
– Share of workers employed by small businesses: 45.4% (1.5 million)
– Share of businesses that are small: 97.7% (141,939)
– Annual payroll of small businesses: $90.9B (38.0% of state’s private payroll)
– 2022 small business applications through November: 65,865 (39.5% likely to become employers)

stefanolunardi // Shutterstock
#37. Utah
Young adult working in a biking repair shop.
– Share of workers employed by small businesses: 45.5% (625,571)
– Share of businesses that are small: 96.9% (68,371)
– Annual payroll of small businesses: $27.1B (40.1% of state’s private payroll)
– 2022 small business applications through November: 59,709 (28.5% likely to become employers)

iJeab // Shutterstock
#34. Minnesota (tie)
Online business owner packing box for shipment.
– Share of workers employed by small businesses: 46.0% (1.3 million)
– Share of businesses that are small: 97.5% (116,317)
– Annual payroll of small businesses: $57.8B (37.6% of state’s private payroll)
– 2022 small business applications through November: 56,372 (32.8% likely to become employers)
Monkey Business Images // Shutterstock
#34. Virginia (tie)
Employee checking stock on digital tablet.
– Share of workers employed by small businesses: 46.0% (1.6 million)
– Share of businesses that are small: 97.6% (151,283)
– Annual payroll of small businesses: $79.1B (40.1% of state’s private payroll)
– 2022 small business applications through November: 113,544 (28.7% likely to become employers)
James Kirkikis // Shutterstock
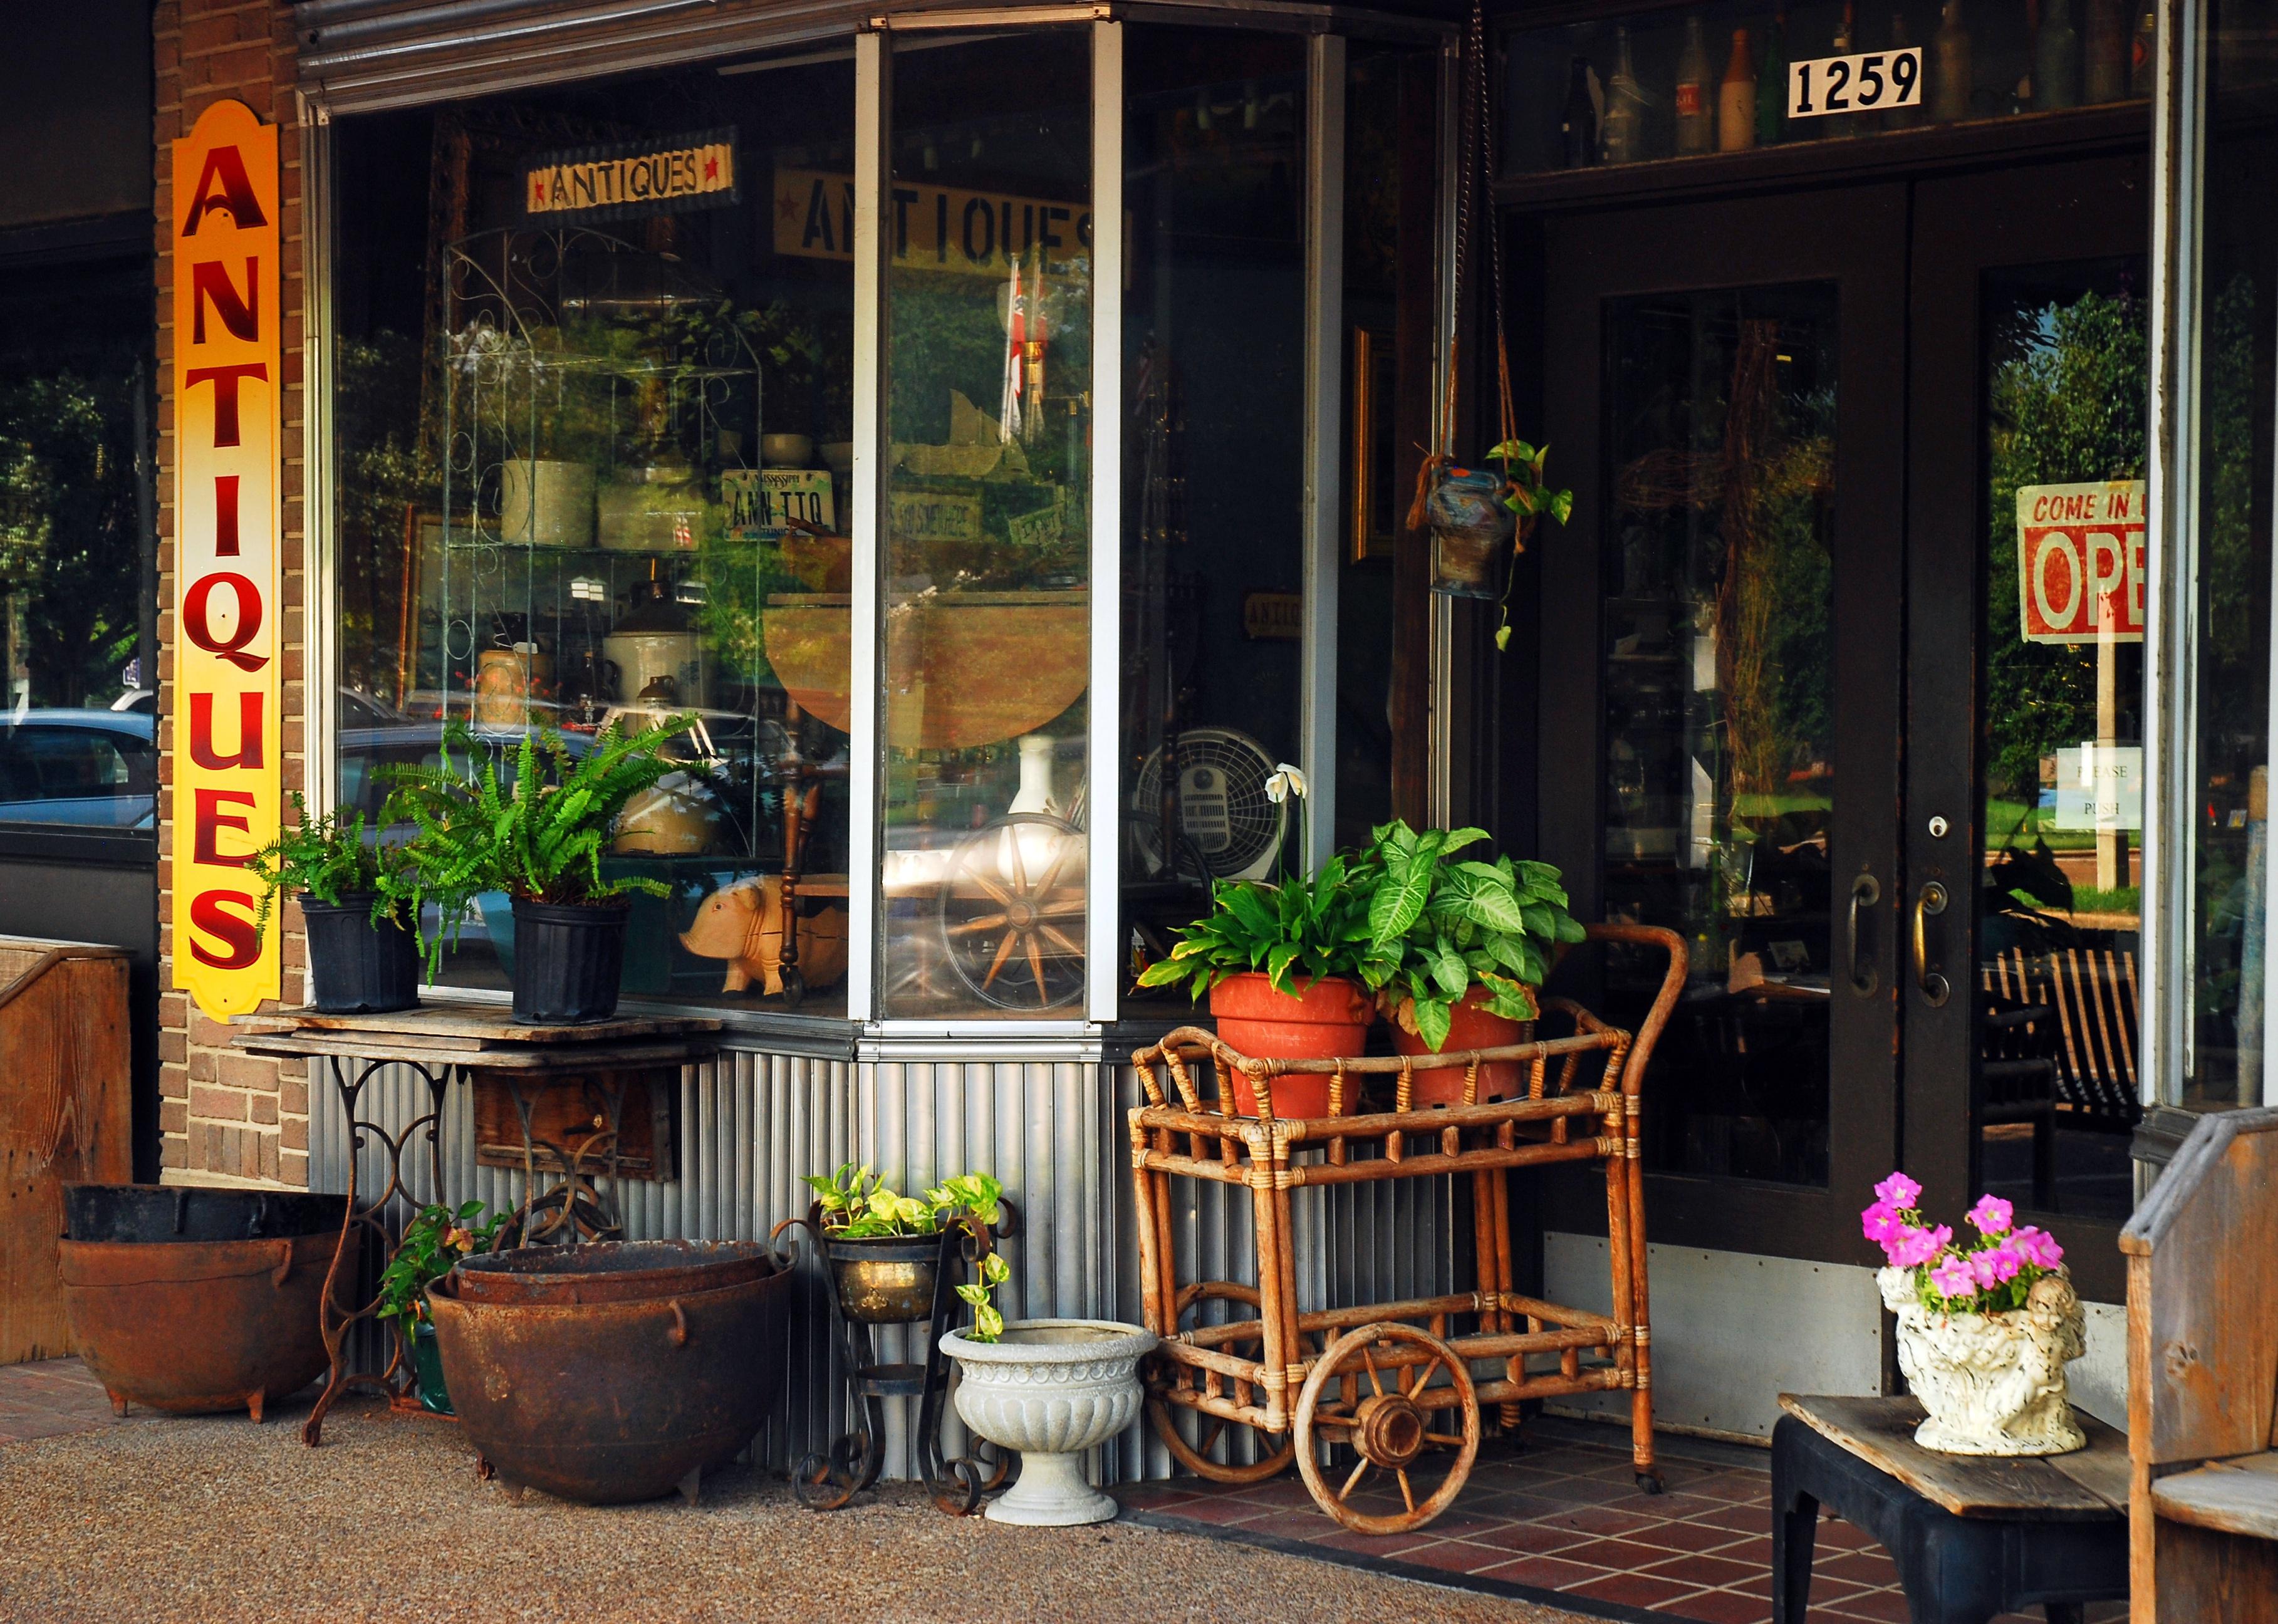
#34. Mississippi (tie)
An antique store in Tunica, Mississippi.
– Share of workers employed by small businesses: 46.0% (441,099)
– Share of businesses that are small: 95.8% (42,411)
– Annual payroll of small businesses: $15.7B (41.5% of state’s private payroll)
– 2022 small business applications through November: 51,288 (30.3% likely to become employers)
James Kirkikis // Shutterstock
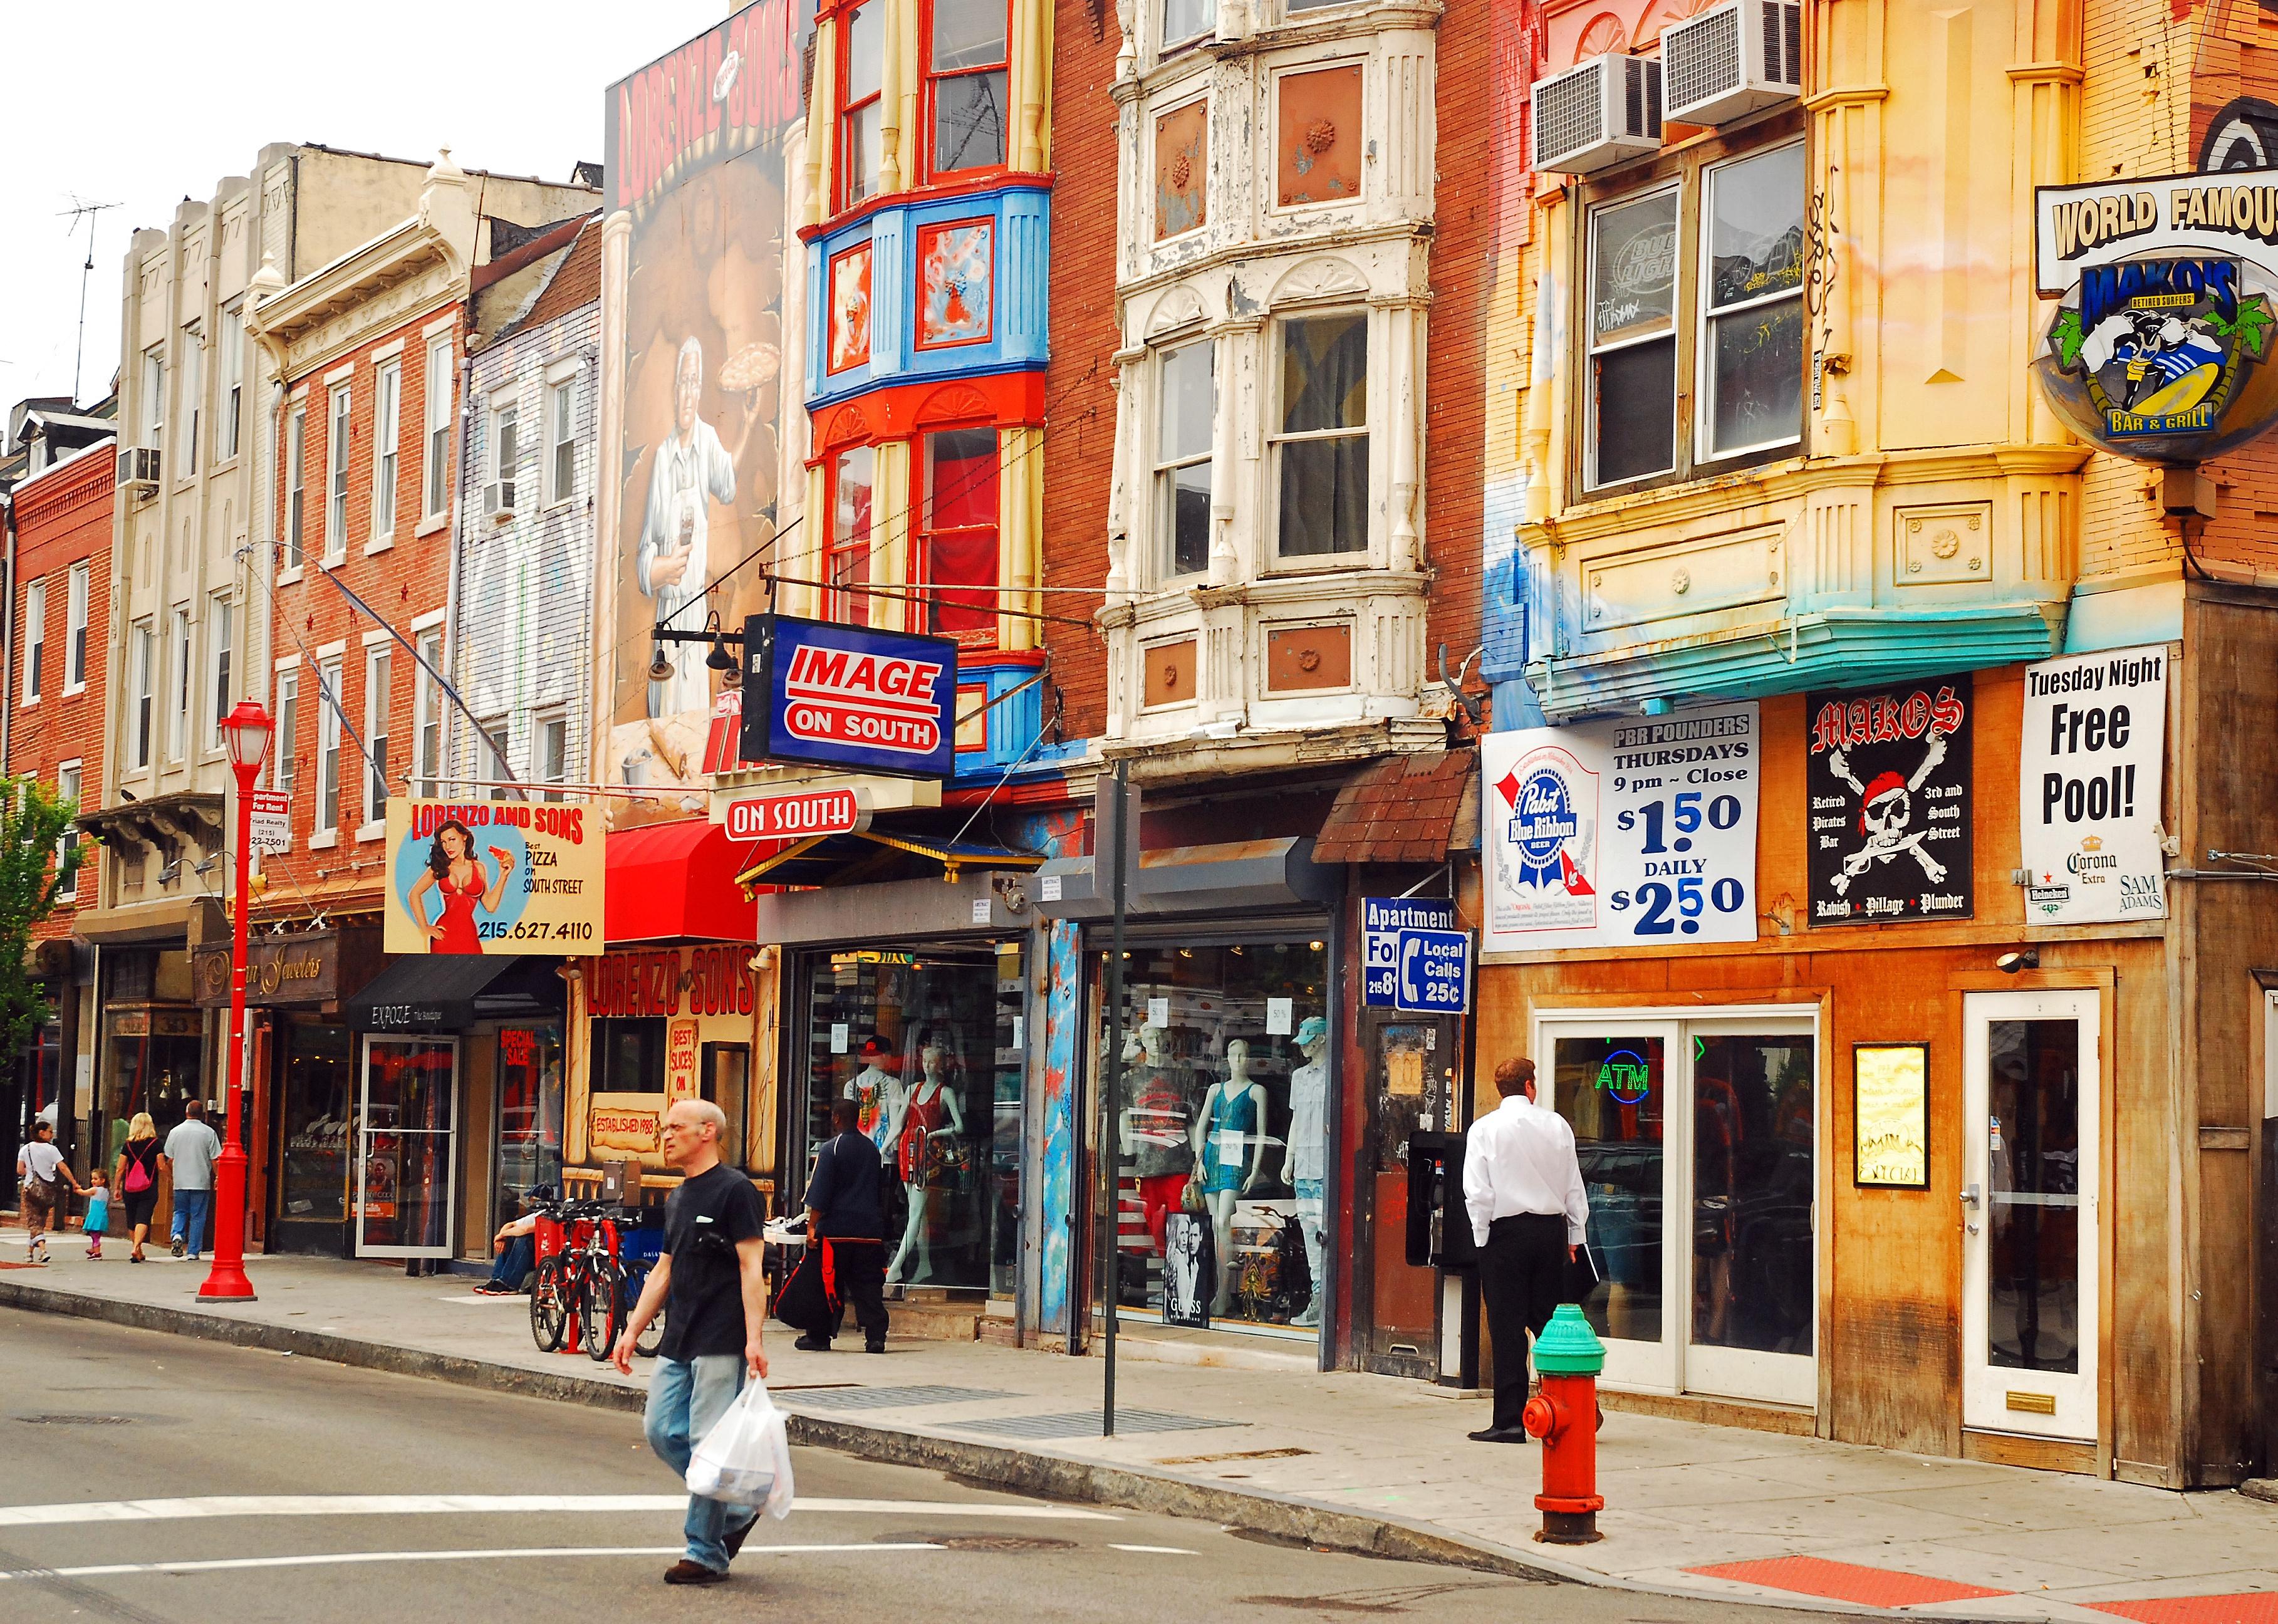
#33. Pennsylvania
Philadelphia street with small businesses.
– Share of workers employed by small businesses: 46.2% (2.6 million)
– Share of businesses that are small: 98.1% (226,511)
– Annual payroll of small businesses: $115.8B (39.3% of state’s private payroll)
– 2022 small business applications through November: 128,239 (30.4% likely to become employers)

Rawpixel.com // Shutterstock
#32. Iowa
High view of coffee shop with customers.
– Share of workers employed by small businesses: 46.6% (644,100)
– Share of businesses that are small: 96.8% (61,192)
– Annual payroll of small businesses: $26.4B (41.4% of state’s private payroll)
– 2022 small business applications through November: 27,793 (30.3% likely to become employers)
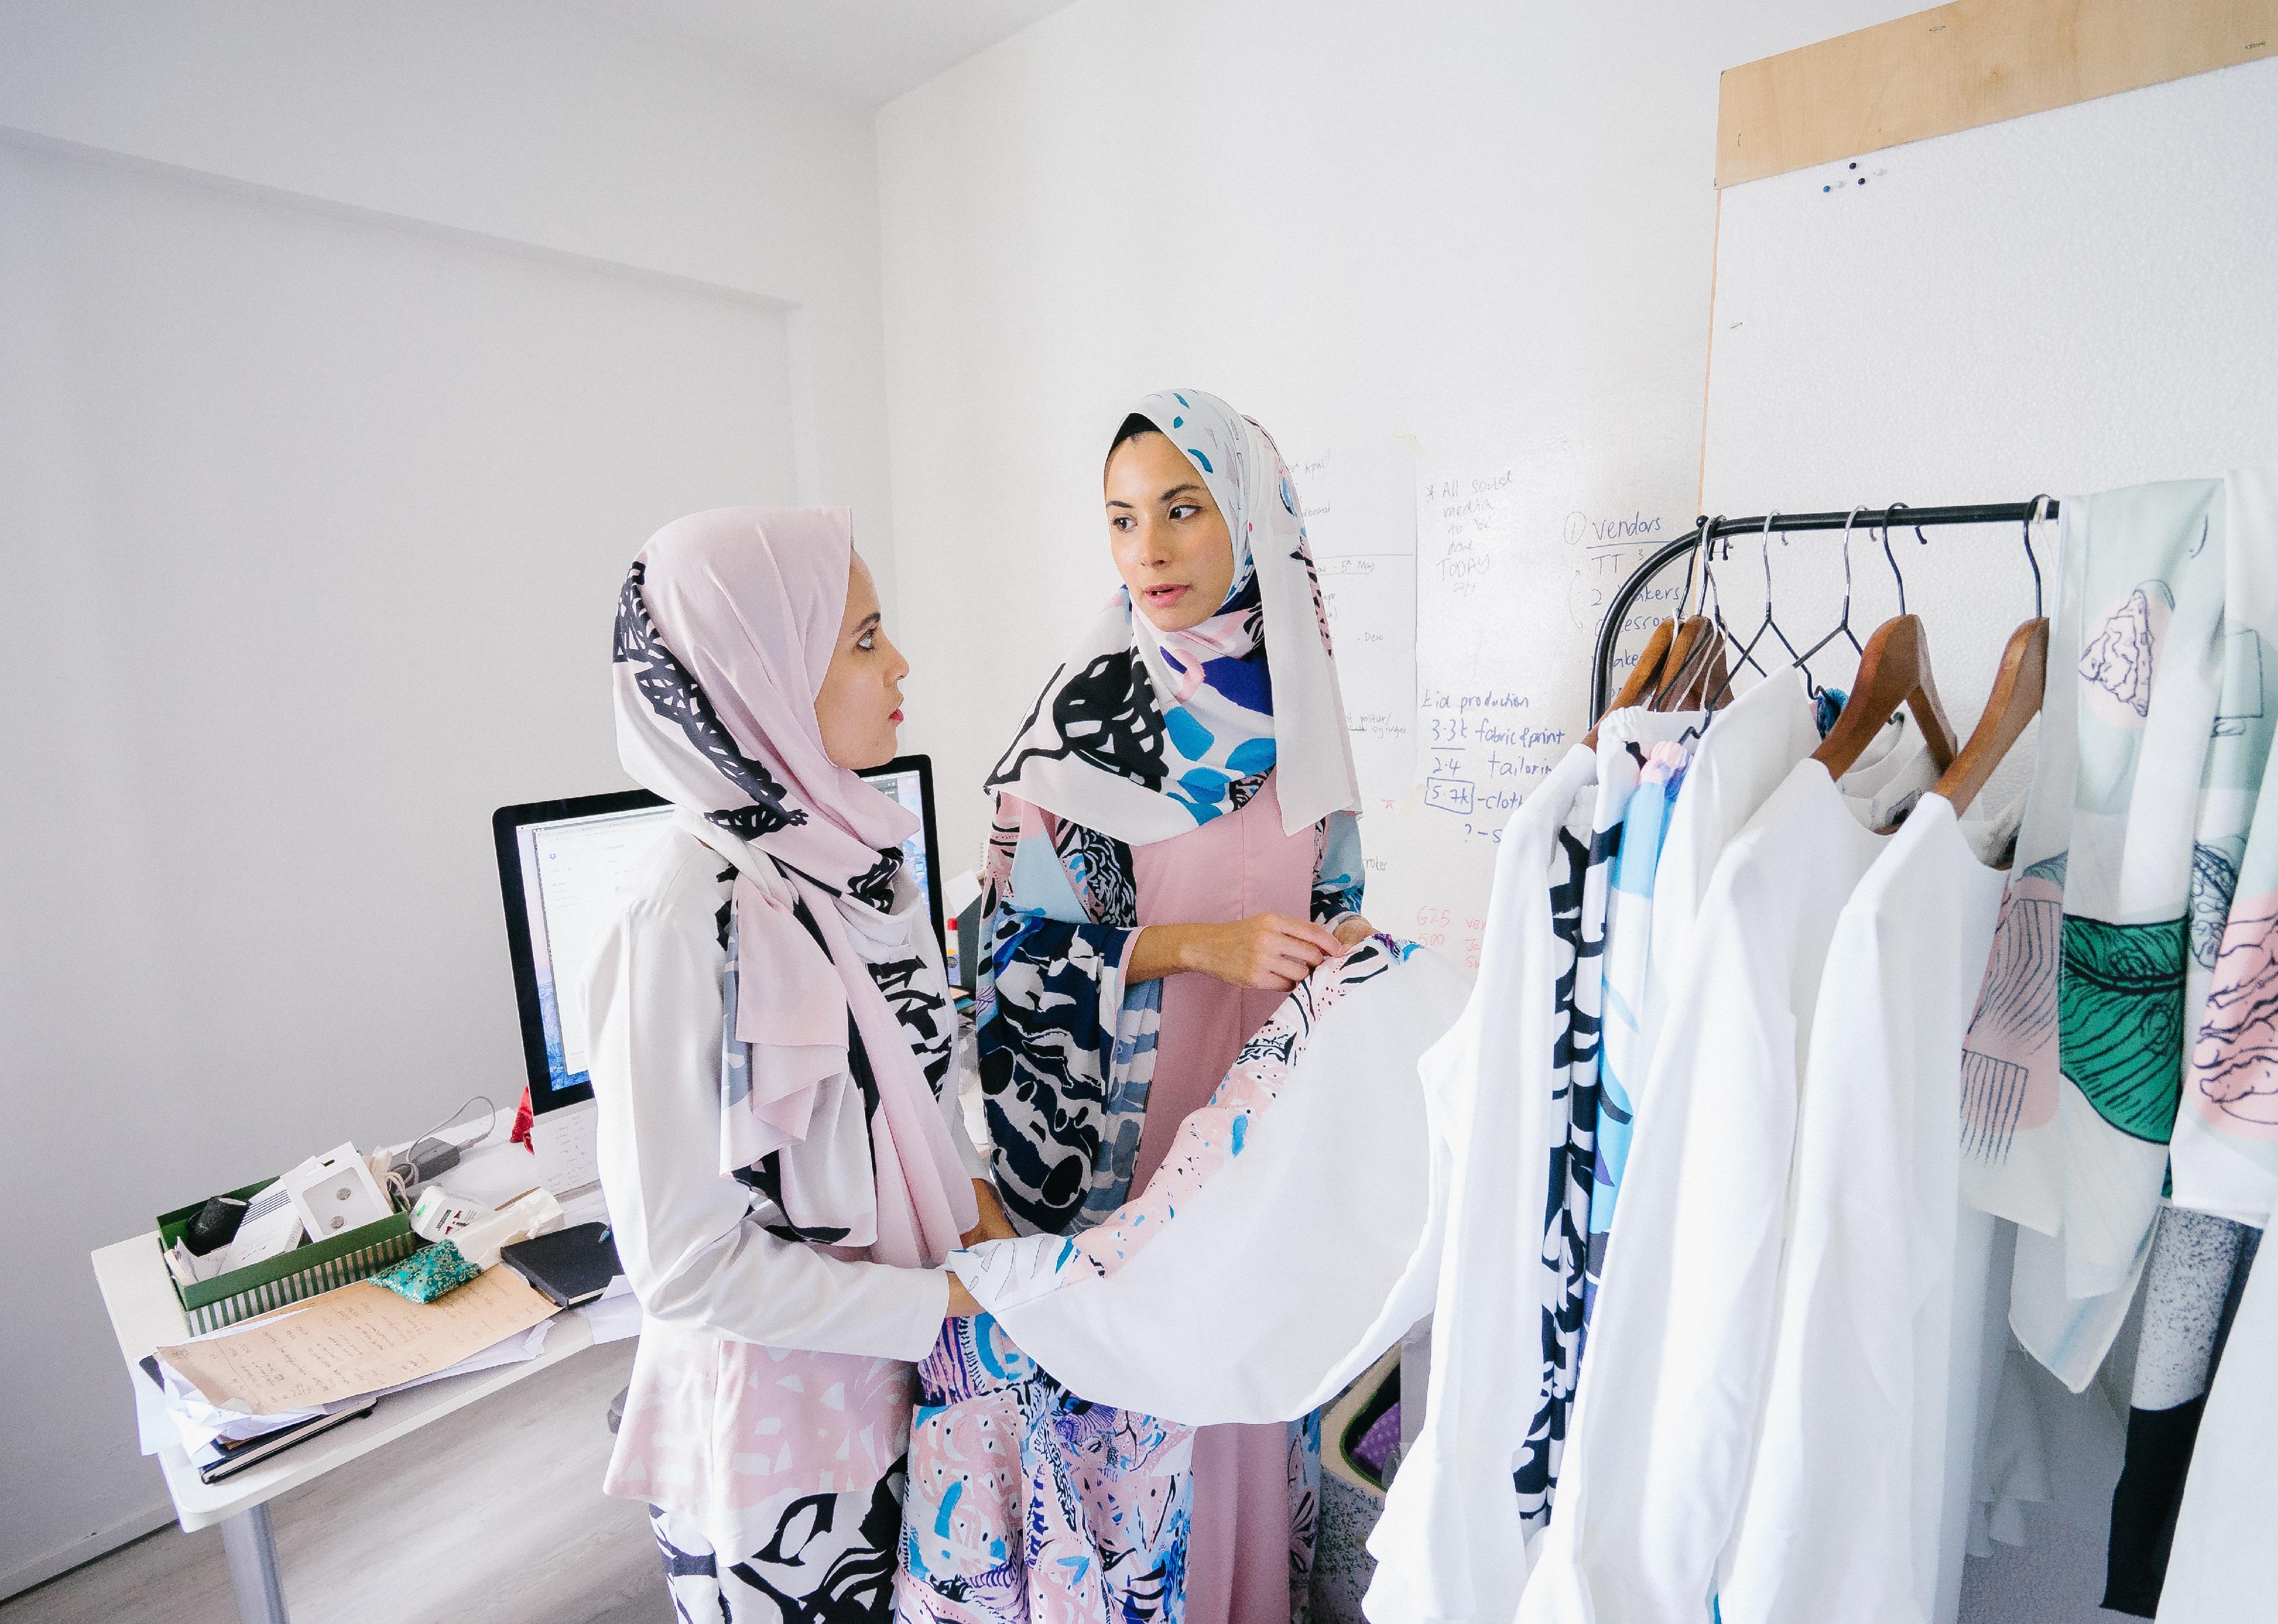
mentatdgt // Shutterstock
#31. Alabama
Two people chatting by retail clothing rack.
– Share of workers employed by small businesses: 46.8% (822,668)
– Share of businesses that are small: 96.4% (71,997)
– Annual payroll of small businesses: $33.7B (42.4% of state’s private payroll)
– 2022 small business applications through November: 65,708 (27.5% likely to become employers)
DGLimages // Shutterstock
#30. Arkansas
Room shot of a busy cafe full of people socializing.
– Share of workers employed by small businesses: 47.2% (497,605)
– Share of businesses that are small: 96.3% (49,321)
– Annual payroll of small businesses: $18.5B (39.9% of state’s private payroll)
– 2022 small business applications through November: 34,686 (31.1% likely to become employers)

88studio // Shutterstock
#29. Delaware
Small business owner packing cardboard box at workplace.
– Share of workers employed by small businesses: 47.4% (195,792)
– Share of businesses that are small: 93.4% (19,768)
– Annual payroll of small businesses: $9.7B (40.5% of state’s private payroll)
– 2022 small business applications through November: 41,852 (31.8% likely to become employers)

Jacob Lund // Shutterstock
#28. Colorado
Two people in warehouse packing a shipment.
– Share of workers employed by small businesses: 47.6% (1.2 million)
– Share of businesses that are small: 97.6% (140,662)
– Annual payroll of small businesses: $58.3B (41.0% of state’s private payroll)
– 2022 small business applications through November: 106,527 (32.8% likely to become employers)

Pressmaster // Shutterstock
#26. California (tie)
Fashion designer looking through fabric samples.
– Share of workers employed by small businesses: 47.9% (7.4 million)
– Share of businesses that are small: 99.2% (783,945)
– Annual payroll of small businesses: $415.0B (38.5% of state’s private payroll)
– 2022 small business applications through November: 448,998 (42.3% likely to become employers)

Zivica Kerkez // Shutterstock
#26. Michigan (tie)
Person drilling laminate with power drill on the table.
– Share of workers employed by small businesses: 47.9% (1.9 million)
– Share of businesses that are small: 98.0% (170,405)
– Annual payroll of small businesses: $85.4B (42.0% of state’s private payroll)
– 2022 small business applications through November: 125,765 (28.0% likely to become employers)

Kenneth Sponsler // Shutterstock
#25. New York
Small businesses line the sidewalk in charming upstate New York town.
– Share of workers employed by small businesses: 48.1% (4.1 million)
– Share of businesses that are small: 98.9% (461,206)
– Annual payroll of small businesses: $230.1B (38.2% of state’s private payroll)
– 2022 small business applications through November: 275,163 (41.3% likely to become employers)

Jacob Lund // Shutterstock
#24. Connecticut
Fashion designer sketching a design sitting at a table.
– Share of workers employed by small businesses: 48.2% (741,920)
– Share of businesses that are small: 96.7% (68,118)
– Annual payroll of small businesses: $39.5B (39.4% of state’s private payroll)
– 2022 small business applications through November: 41,152 (29.2% likely to become employers)
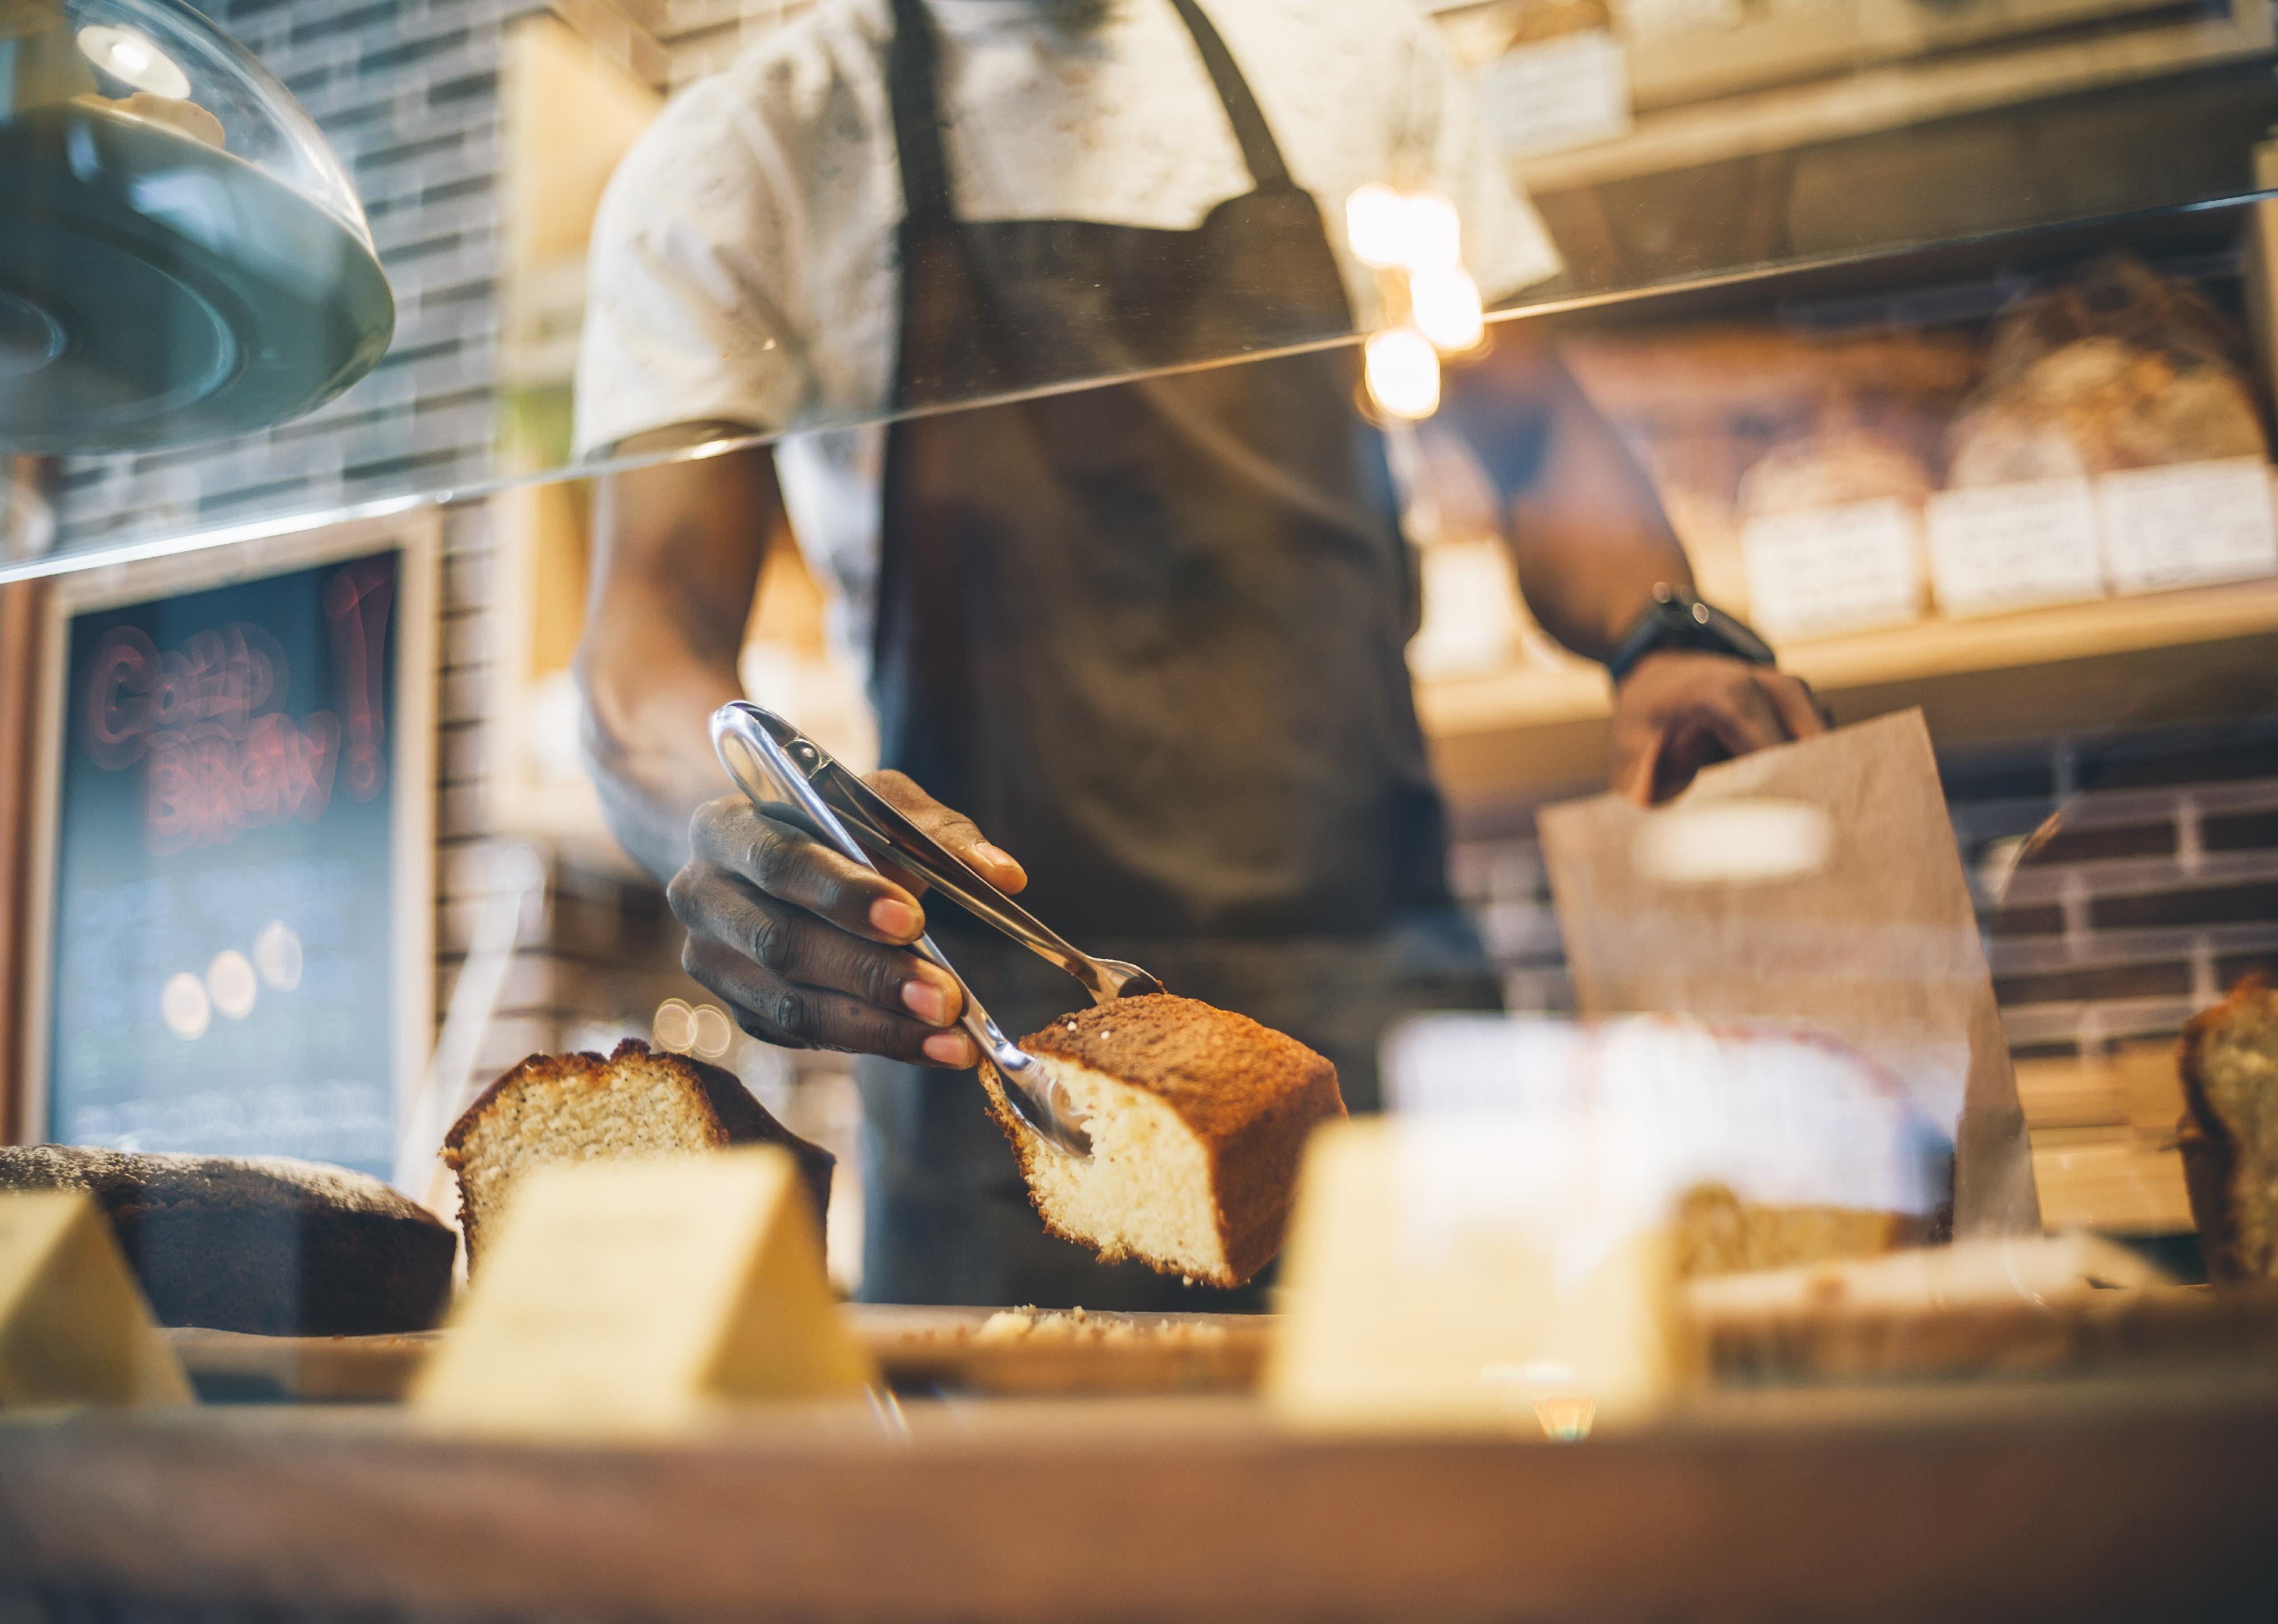
Carrastock // Shutterstock
#23. Nebraska
Employee getting something from pastry display in small store.
– Share of workers employed by small businesses: 48.3% (413,735)
– Share of businesses that are small: 96.3% (42,117)
– Annual payroll of small businesses: $17.0B (43.1% of state’s private payroll)
– 2022 small business applications through November: 18,981 (31.1% likely to become employers)

mavo // Shutterstock
#21. West Virginia (tie)
Happy young coffee shop owner talking on phone while typing on their laptop.
– Share of workers employed by small businesses: 48.6% (269,473)
– Share of businesses that are small: 94.9% (24,717)
– Annual payroll of small businesses: $9.9B (41.6% of state’s private payroll)
– 2022 small business applications through November: 12,709 (31.4% likely to become employers)

Milan Ilic Photographer // Shutterstock
#21. Washington DC (tie)
Group of young architects working in an office.
– Share of workers employed by small businesses: 48.6% (257,236)
– Share of businesses that are small: 92.3% (17,326)
– Annual payroll of small businesses: $19.4B (43.3% of state’s private payroll)
– 2022 small business applications through November: 13,143 (26.8% likely to become employers)

owloncloud // Shutterstock
#20. Wisconsin
Person looking at colorful jewelry at an outdoor market.
– Share of workers employed by small businesses: 48.8% (1.3 million)
– Share of businesses that are small: 97.3% (105,731)
– Annual payroll of small businesses: $53.3B (40.7% of state’s private payroll)
– 2022 small business applications through November: 59,192 (29.8% likely to become employers)

Monkey Business Images // Shutterstock
#19. New Jersey
An employee holding a card reading device attached to digital tablet takes a credit card from a customer.
– Share of workers employed by small businesses: 49.2% (1.9 million)
– Share of businesses that are small: 98.2% (191,253)
– Annual payroll of small businesses: $96.6B (40.3% of state’s private payroll)
– 2022 small business applications through November: 141,760 (29.2% likely to become employers)

Jeff Whyte // Shutterstock
#18. Hawaii
Food trucks on the east shore of Oahu.
– Share of workers employed by small businesses: 49.3% (272,459)
– Share of businesses that are small: 96.0% (24,677)
– Annual payroll of small businesses: $11.6B (44.9% of state’s private payroll)
– 2022 small business applications through November: 17,109 (31.1% likely to become employers)
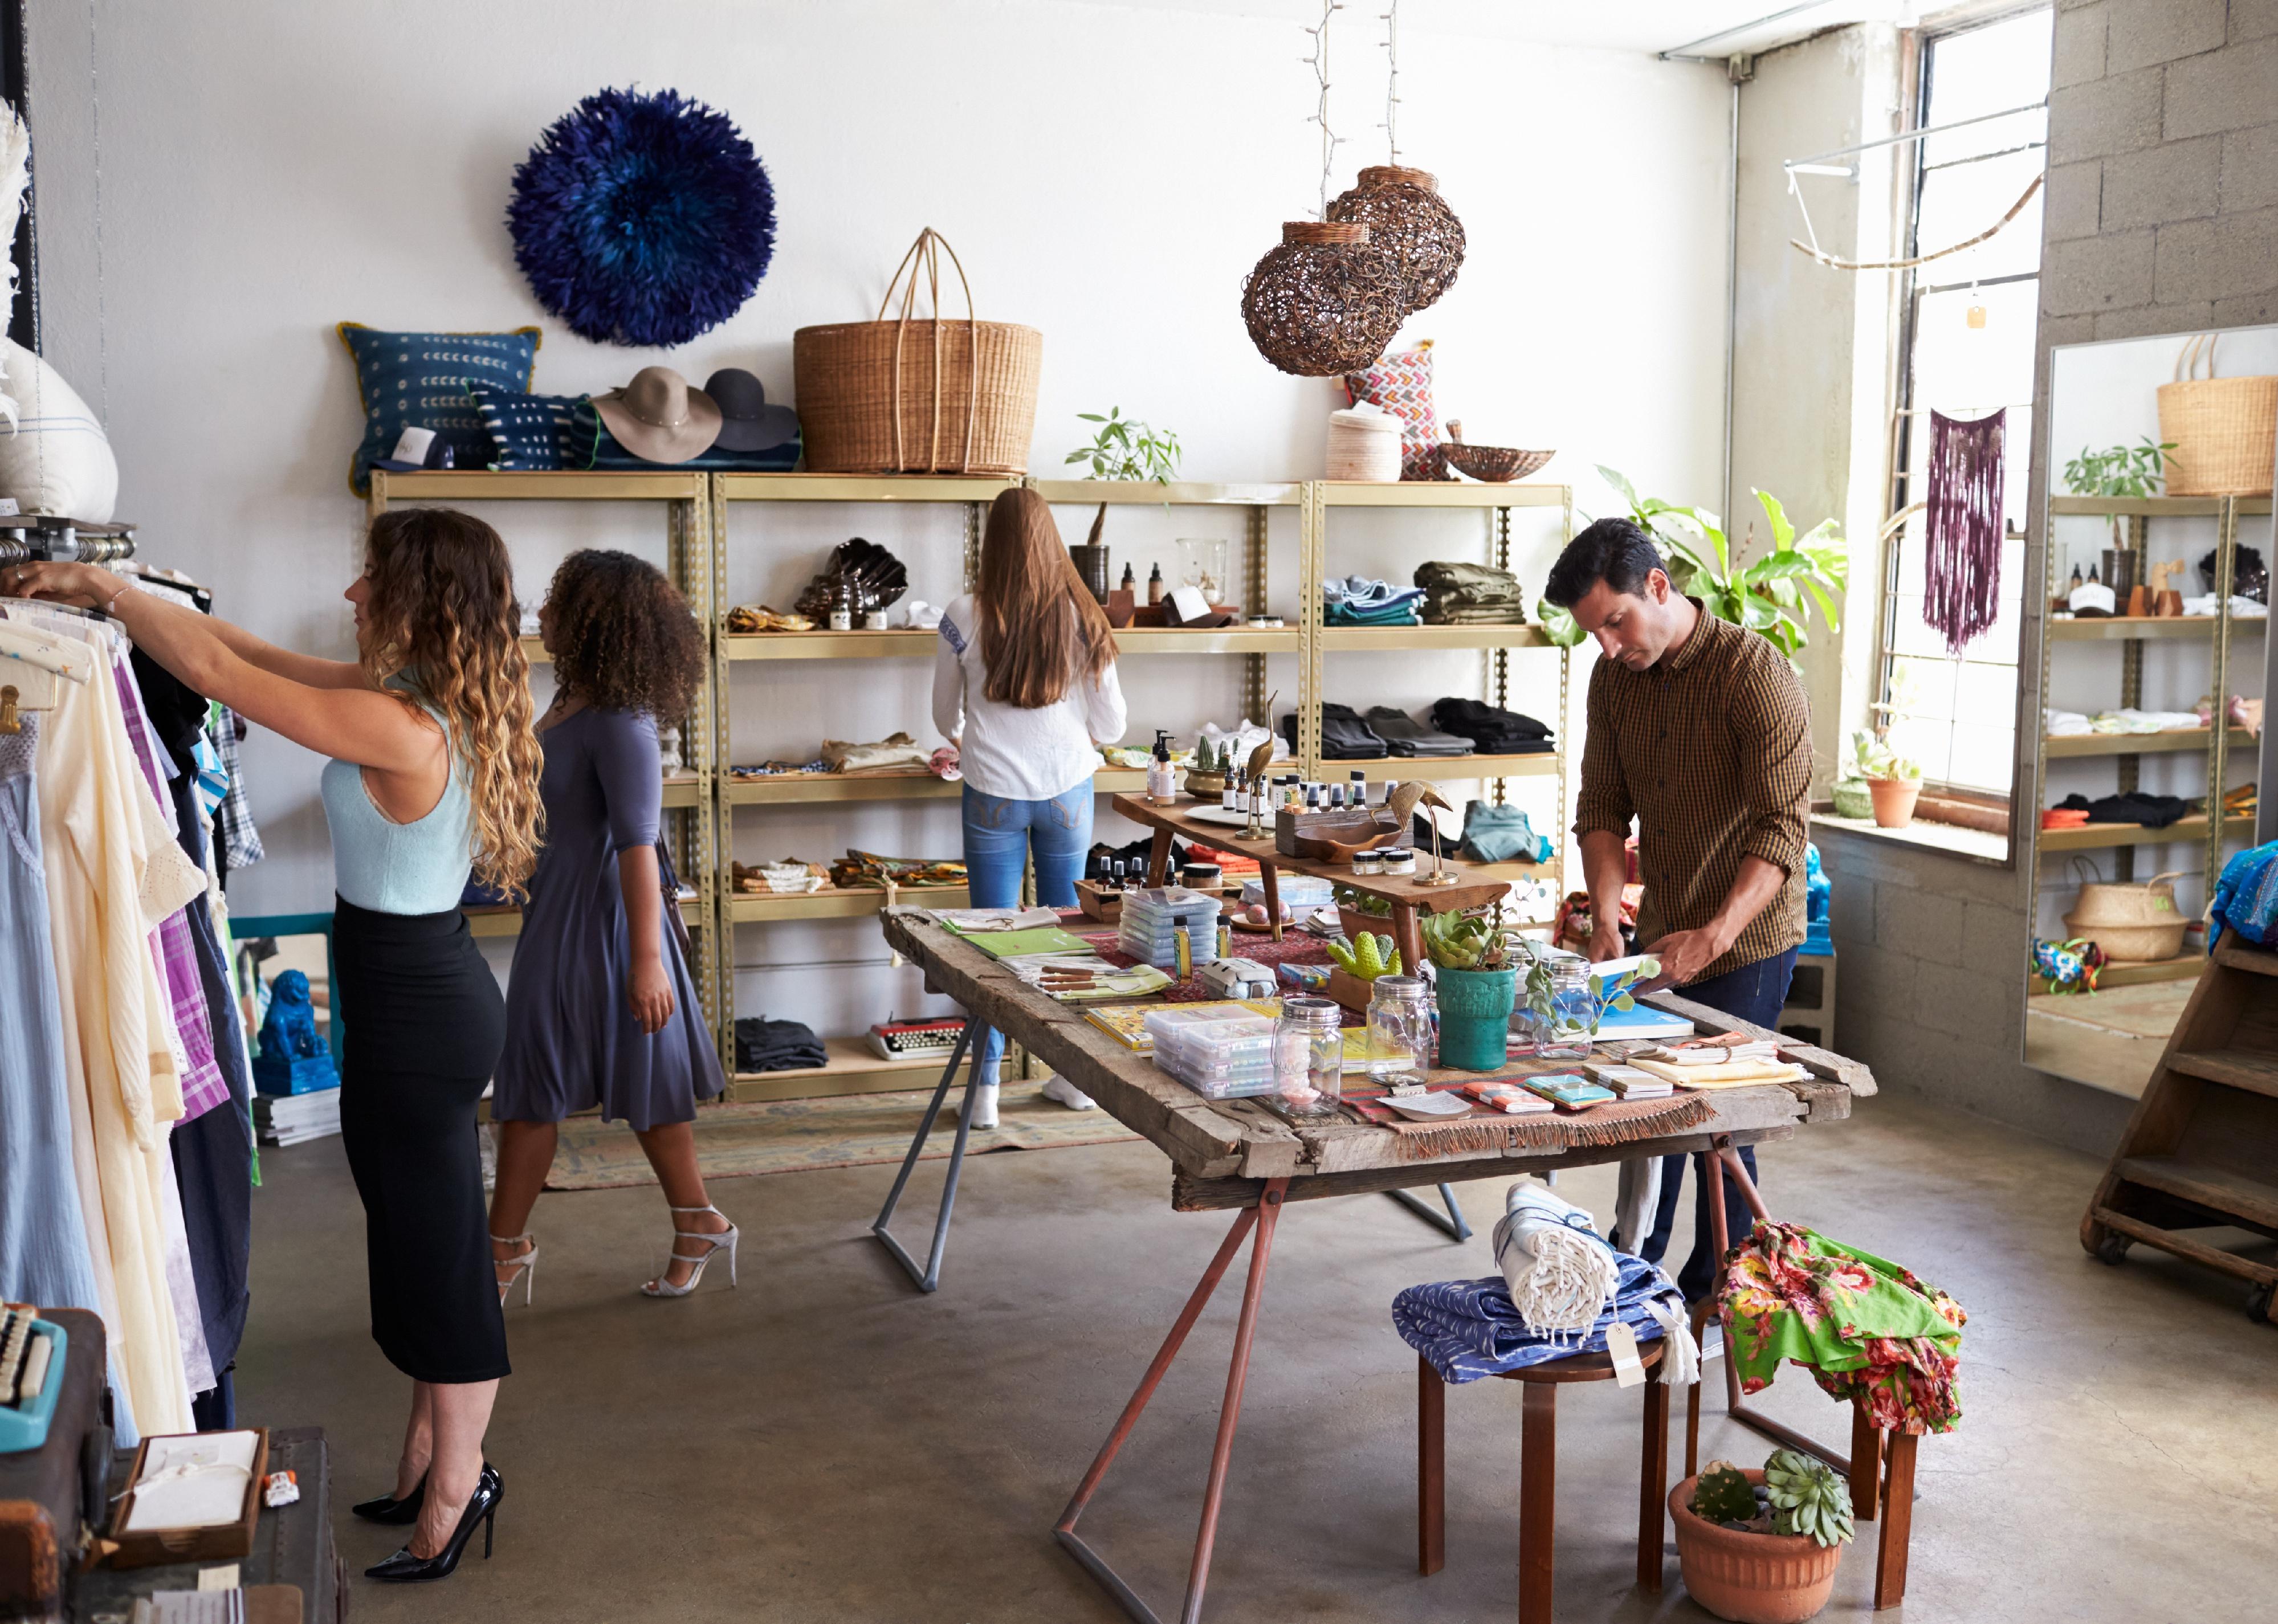
Monkey Business Images // Shutterstock
#17. Maryland
Customers and staff in a busy clothes shop.
– Share of workers employed by small businesses: 49.4% (1.2 million)
– Share of businesses that are small: 97.3% (107,212)
– Annual payroll of small businesses: $61.2B (44.7% of state’s private payroll)
– 2022 small business applications through November: 91,187 (29.0% likely to become employers)
Olga Enger // Shutterstock
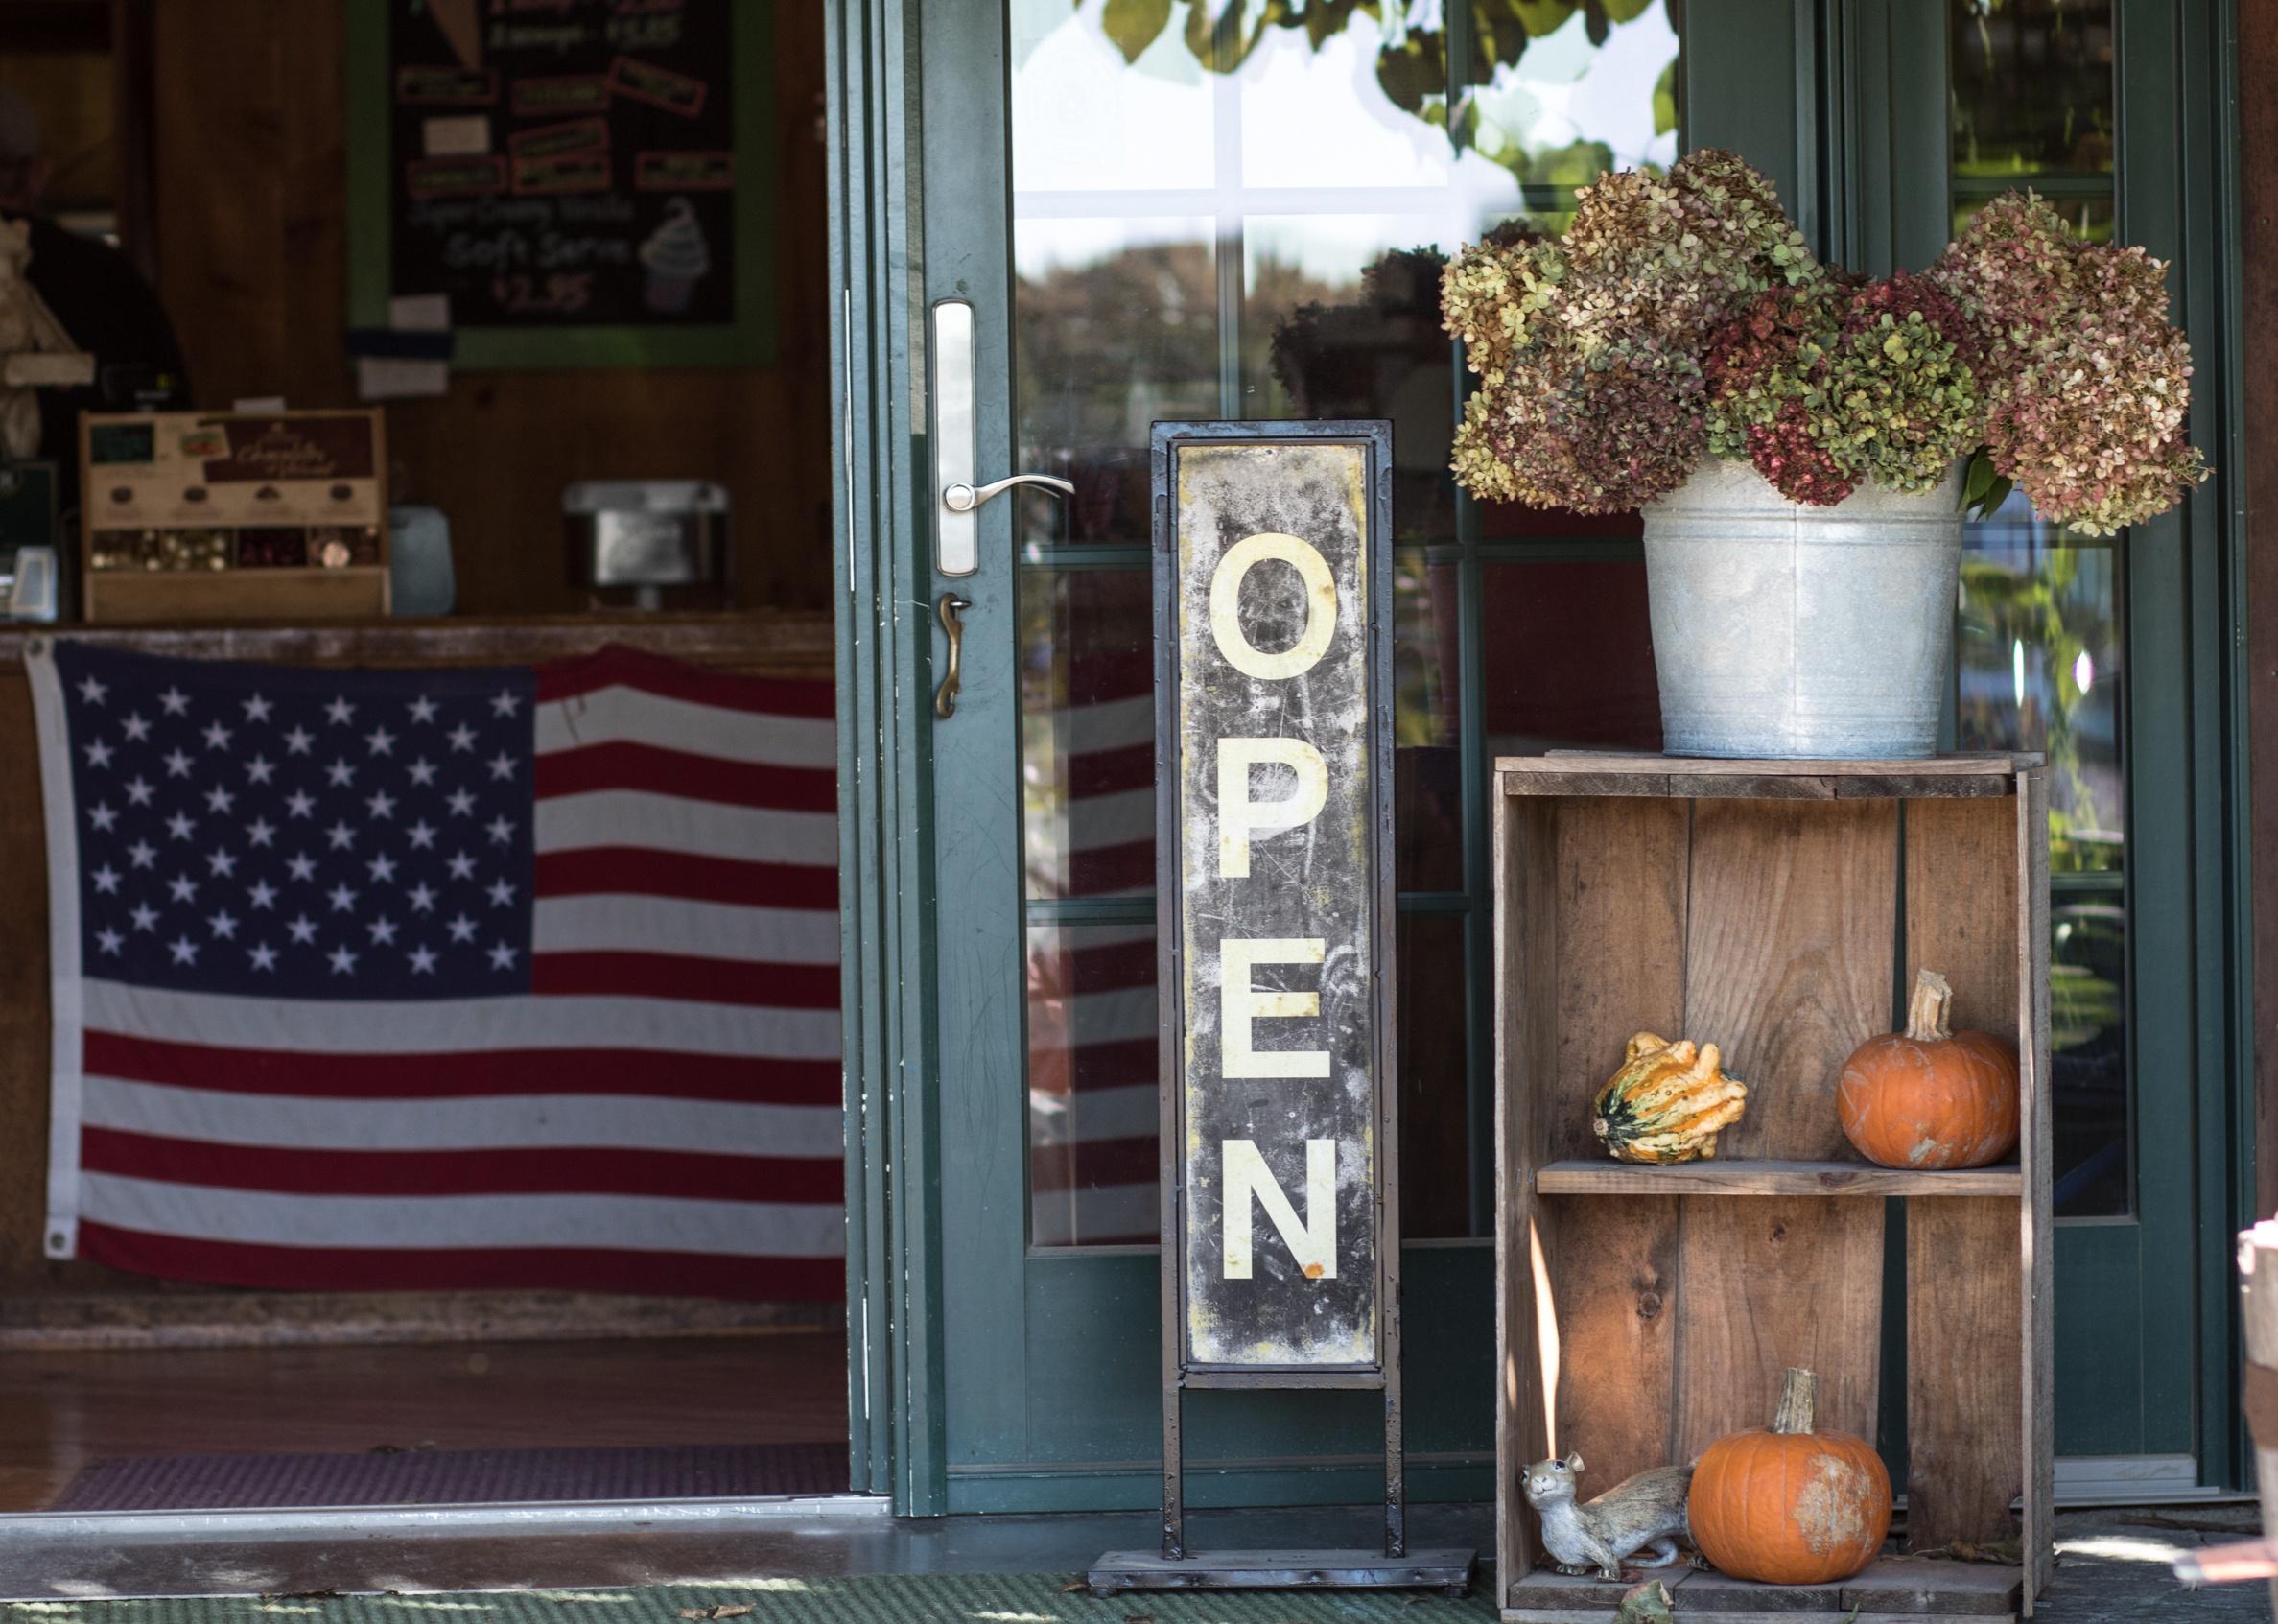
#15. New Hampshire (tie)
A small business with a welcoming open sign.
– Share of workers employed by small businesses: 49.7% (308,296)
– Share of businesses that are small: 95.4% (29,544)
– Annual payroll of small businesses: $15.2B (45.9% of state’s private payroll)
– 2022 small business applications through November: 12,779 (31.3% likely to become employers)
Andriy Blokhin // Shutterstock
#15. Kansas (tie)
Small city in Kansas with downtown main street with historic shops.
– Share of workers employed by small businesses: 49.7% (601,426)
– Share of businesses that are small: 96.0% (55,101)
– Annual payroll of small businesses: $24.9B (43.6% of state’s private payroll)
– 2022 small business applications through November: 28,611 (34.2% likely to become employers)

Jacob Lund // Shutterstock
#14. Washington
Small business owner packing in the cardbox at workplace.
– Share of workers employed by small businesses: 49.8% (1.4 million)
– Share of businesses that are small: 98.0% (156,575)
– Annual payroll of small businesses: $74.4B (38.9% of state’s private payroll)
– 2022 small business applications through November: 81,691 (33.1% likely to become employers)

Aleksandar Karanov // Shutterstock
#13. Oklahoma
Carpenters lifting window frame.
– Share of workers employed by small businesses: 51.1% (718,033)
– Share of businesses that are small: 96.8% (70,983)
– Annual payroll of small businesses: $29.0B (44.5% of state’s private payroll)
– 2022 small business applications through November: 50,743 (30.5% likely to become employers)
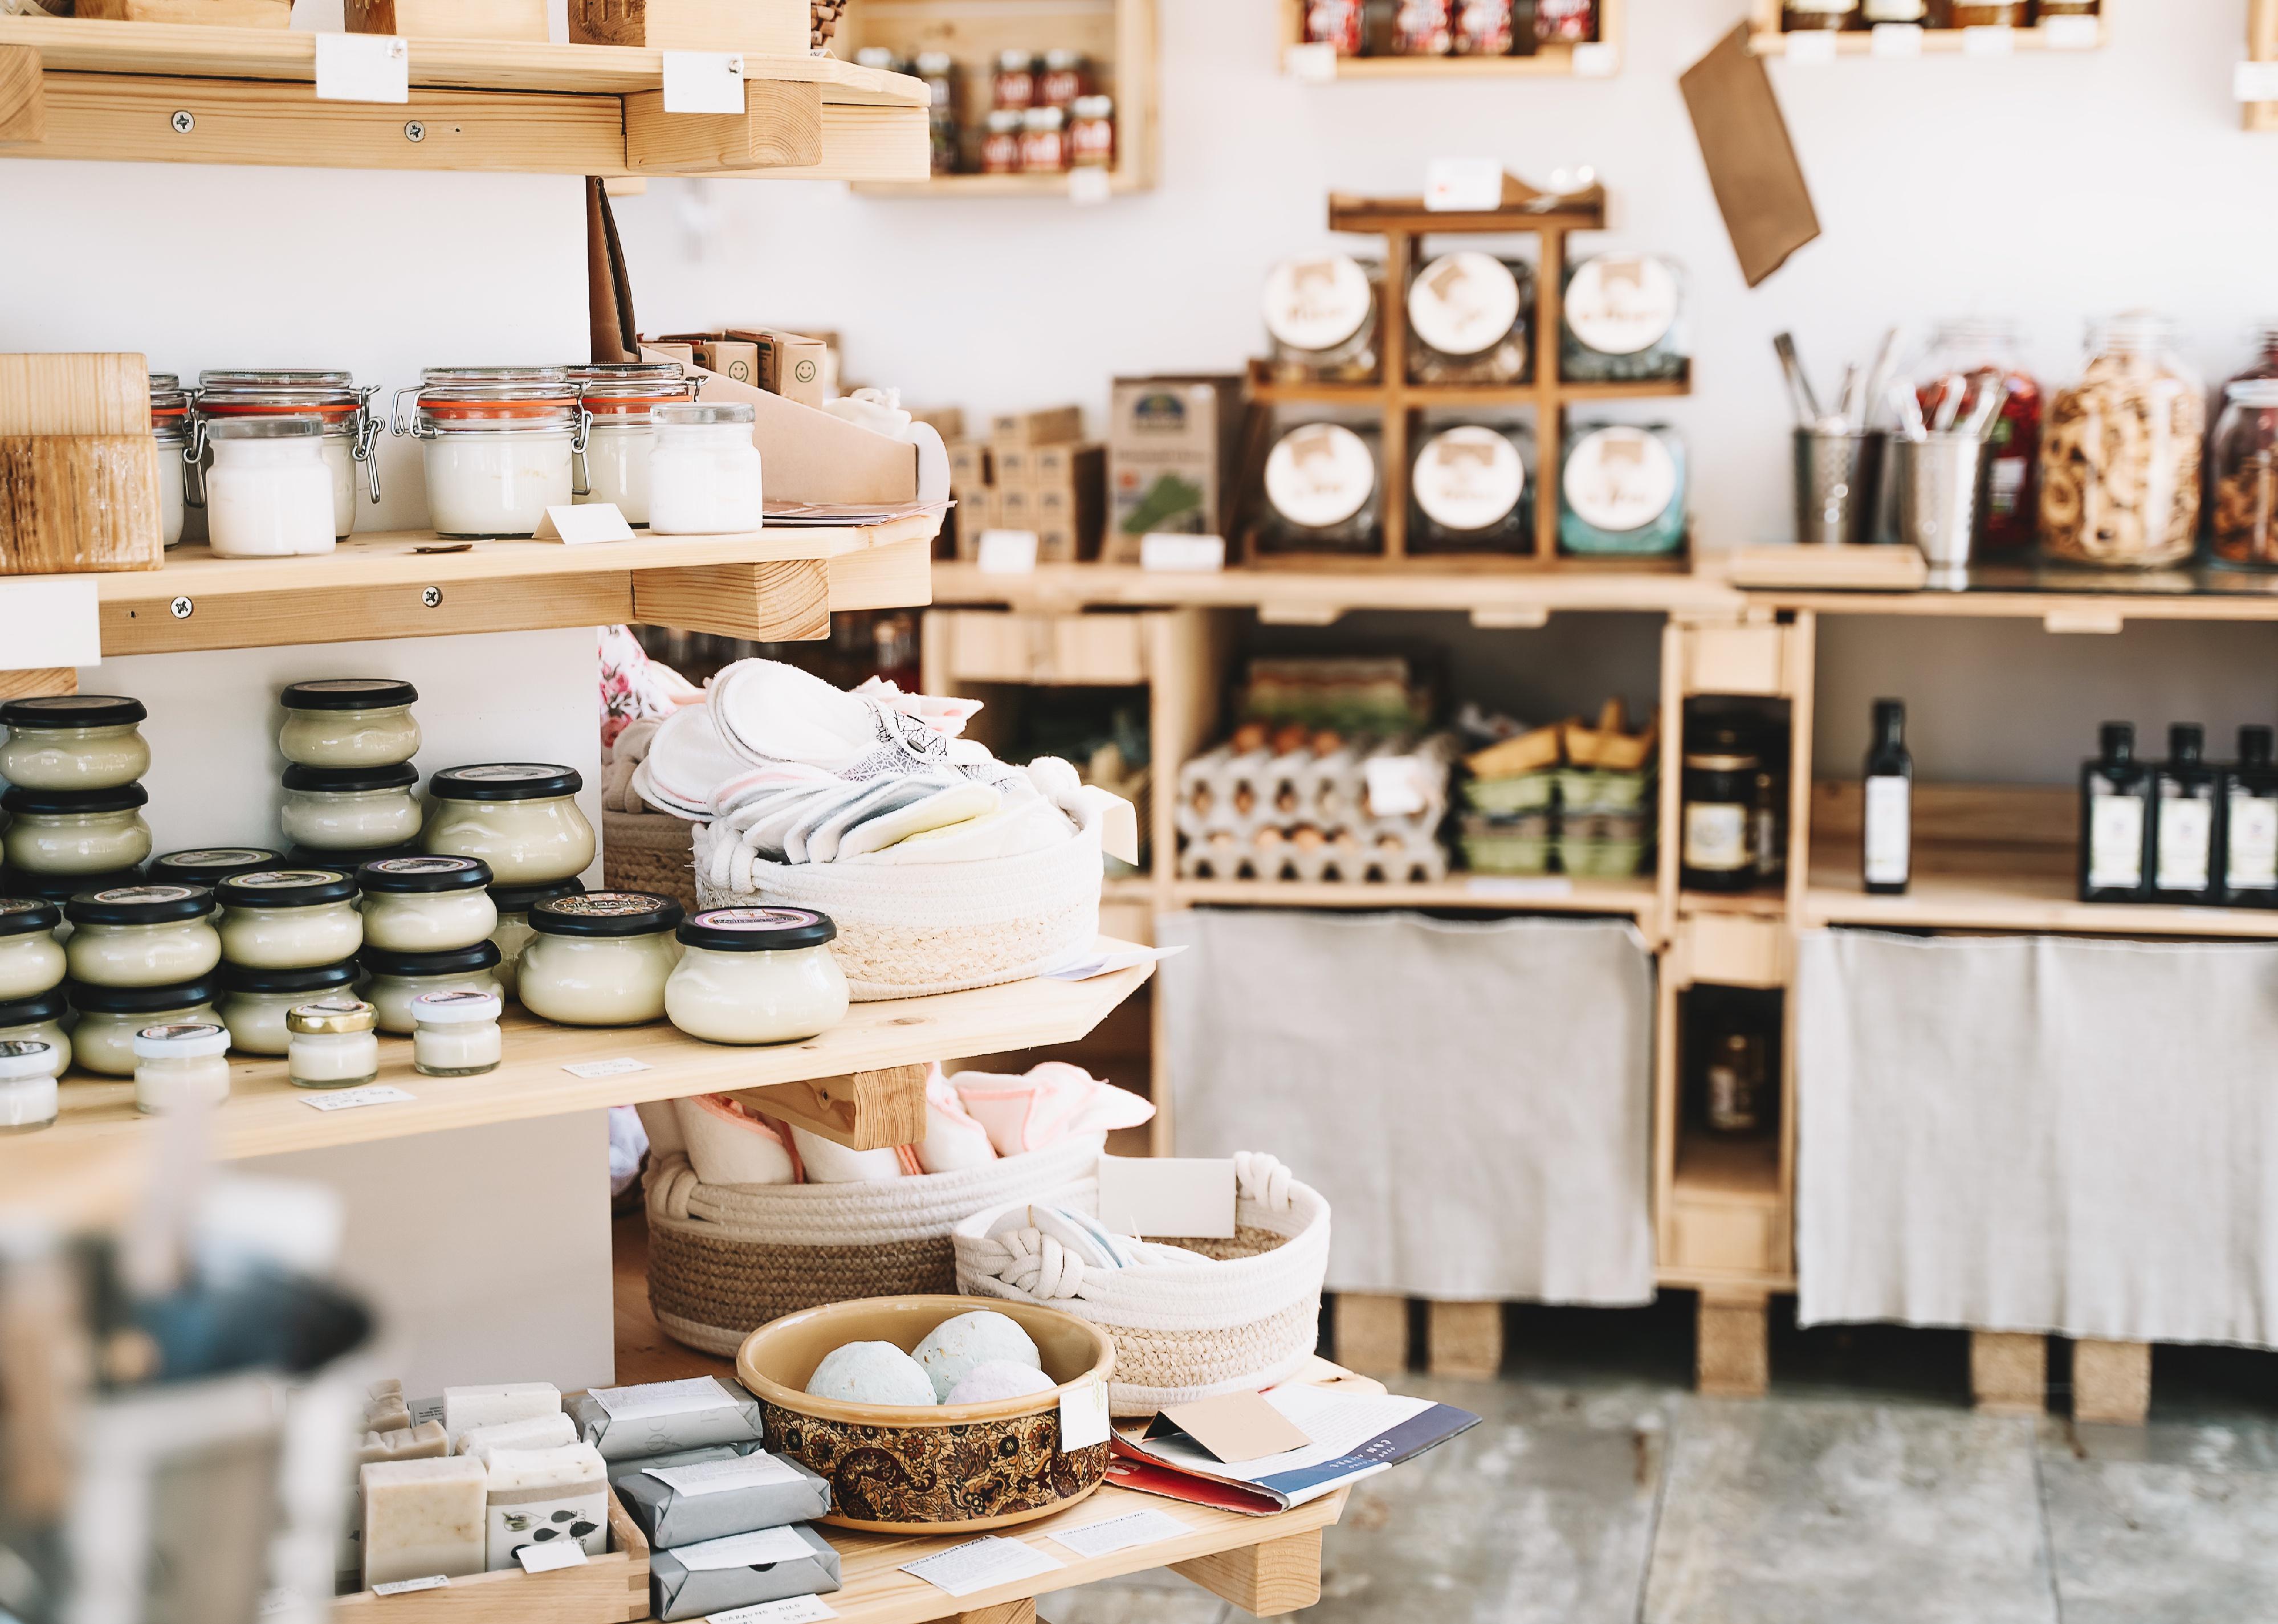
Natalia Deriabina // Shutterstock
#12. Rhode Island
Zero waste shop interior details.
– Share of workers employed by small businesses: 51.2% (227,699)
– Share of businesses that are small: 95.1% (23,244)
– Annual payroll of small businesses: $10.5B (46.2% of state’s private payroll)
– 2022 small business applications through November: 10,060 (33.0% likely to become employers)

Pressmaster // Shutterstock
#11. Alaska
Technician working with metal.
– Share of workers employed by small businesses: 52.3% (138,517)
– Share of businesses that are small: 96.1% (16,691)
– Annual payroll of small businesses: $7.5B (45.5% of state’s private payroll)
– 2022 small business applications through November: 7,788 (35.2% likely to become employers)
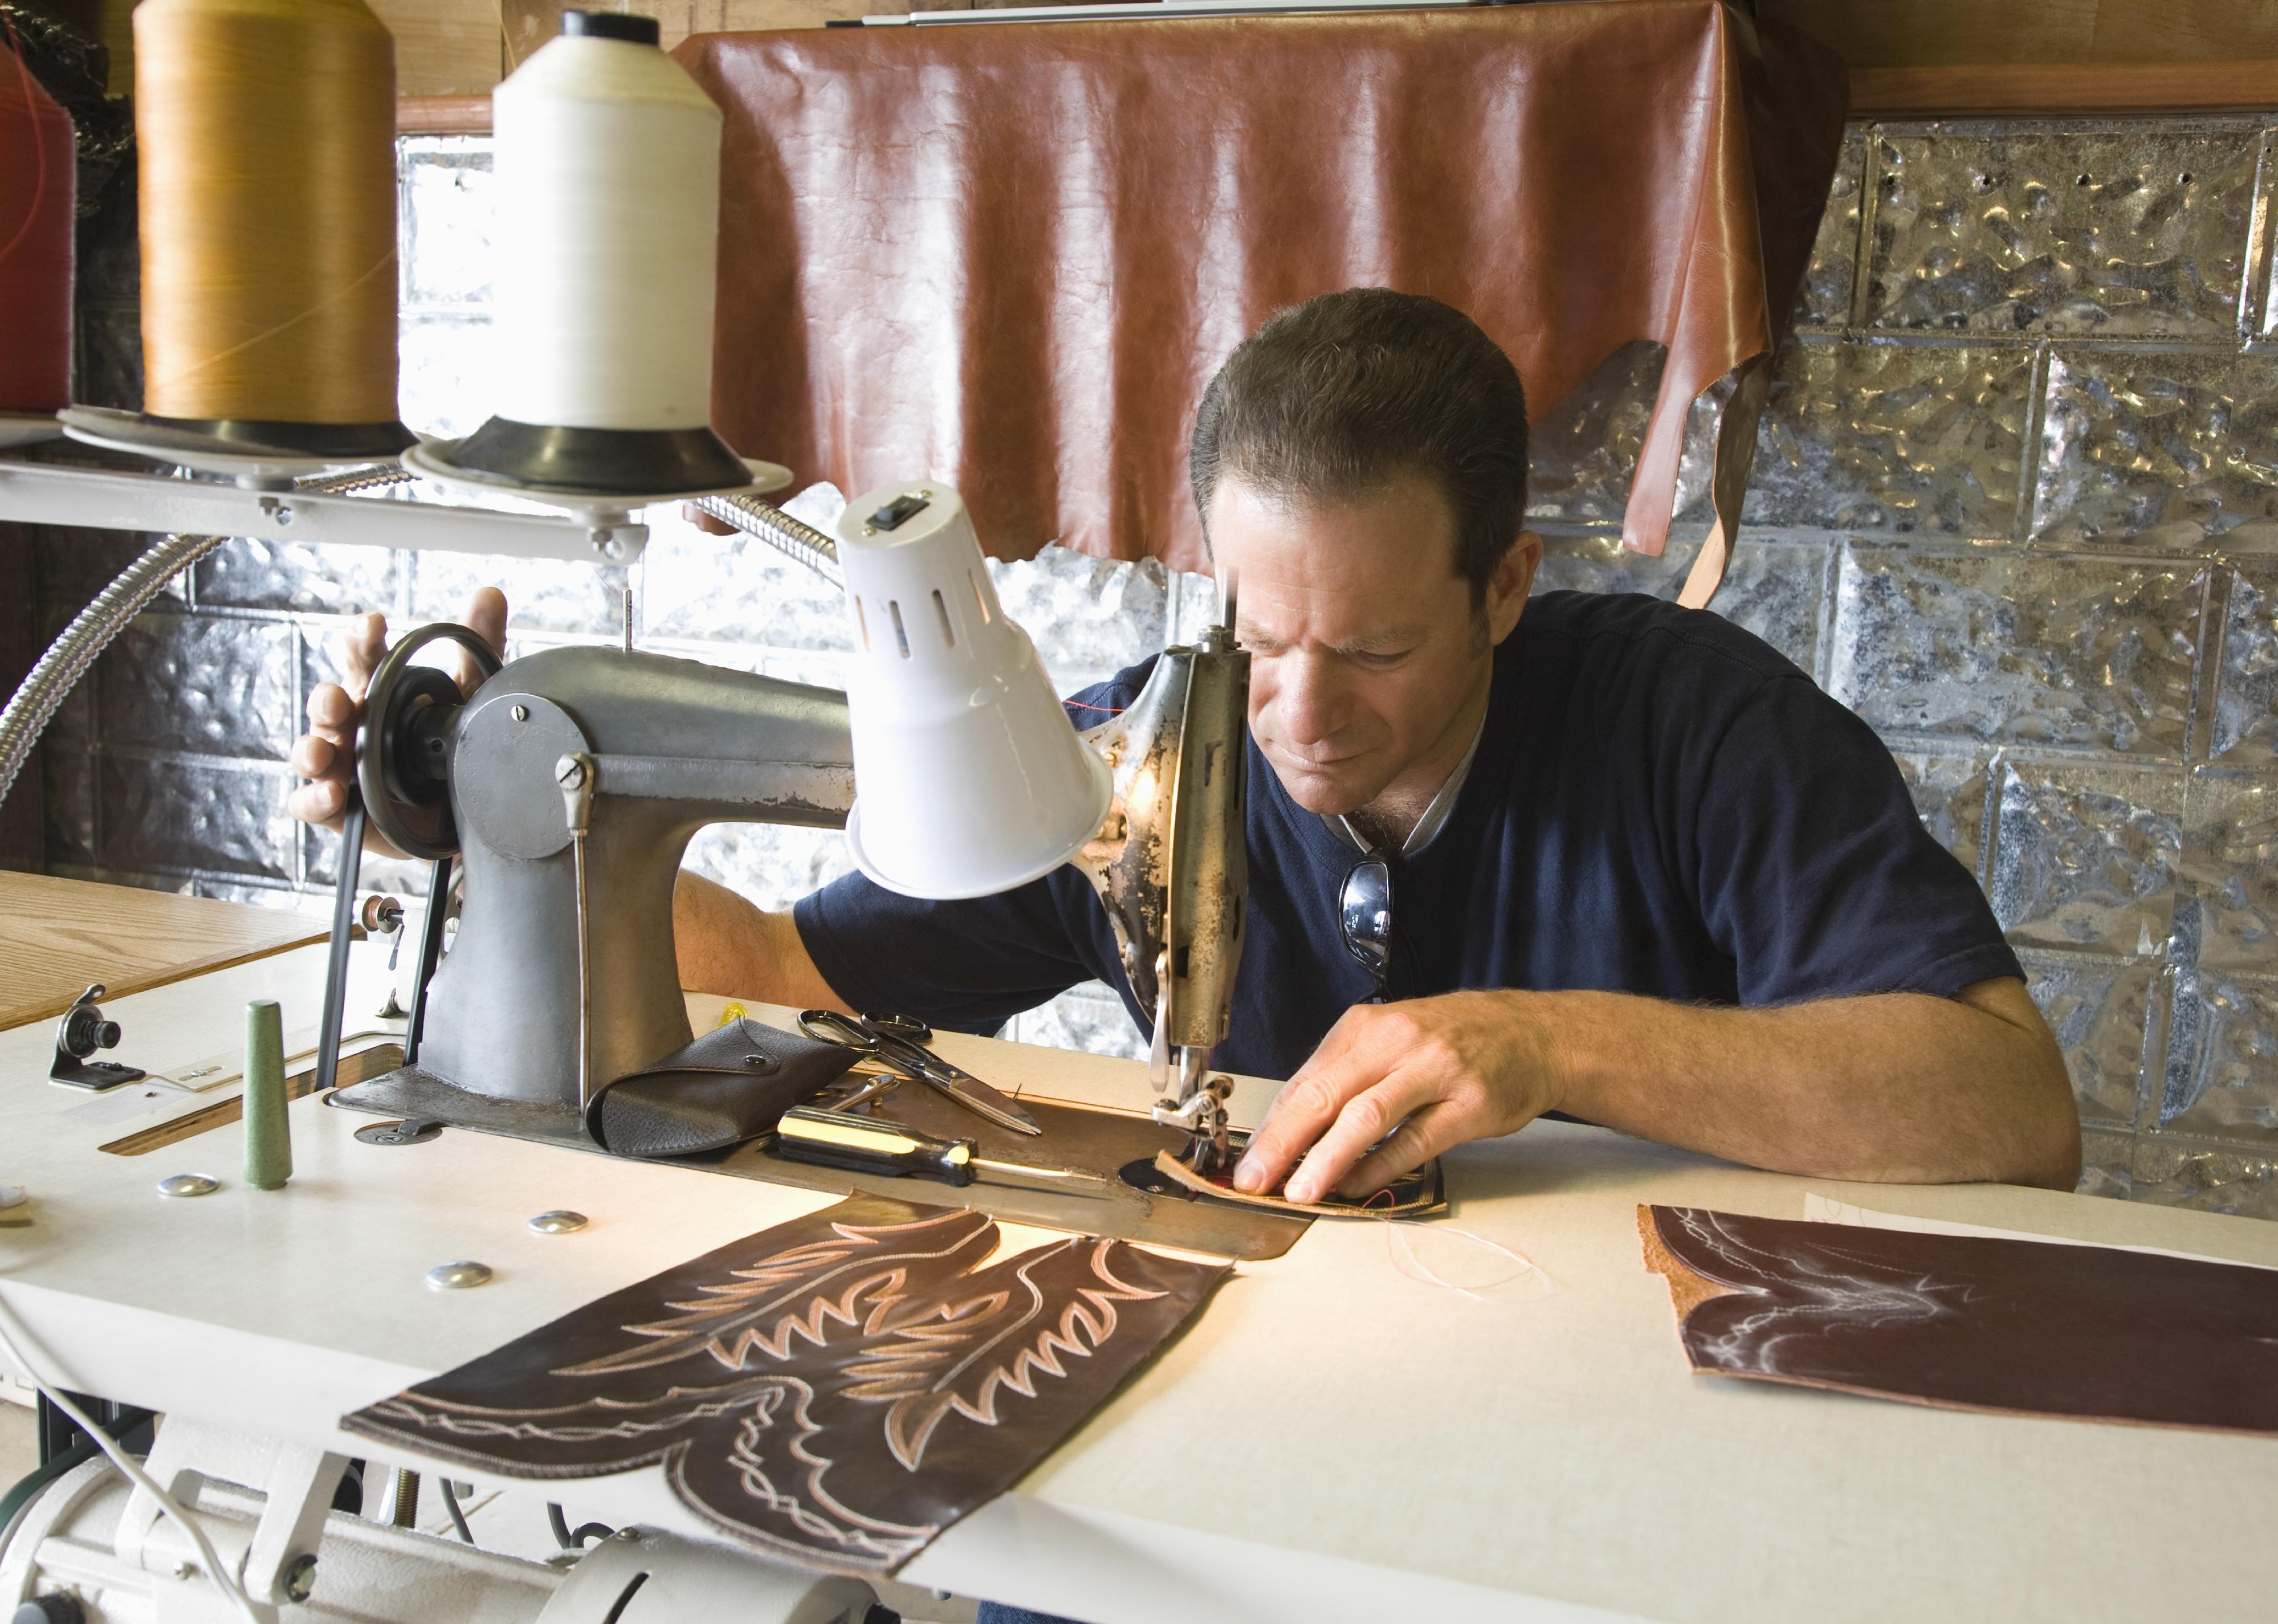
sirtravelalot // Shutterstock
#10. Louisiana
Person working at a traditional shoemaker workshop.
– Share of workers employed by small businesses: 52.7% (905,726)
– Share of businesses that are small: 97.1% (79,135)
– Annual payroll of small businesses: $38.7B (47.0% of state’s private payroll)
– 2022 small business applications through November: 74,272 (26.9% likely to become employers)

Fh Photo // Shutterstock
#9. New Mexico
Two wood designers working with laptop in workshop holding small teacups.
– Share of workers employed by small businesses: 53.7% (346,374)
– Share of businesses that are small: 95.1% (32,776)
– Annual payroll of small businesses: $13.7B (48.7% of state’s private payroll)
– 2022 small business applications through November: 24,845 (28.0% likely to become employers)
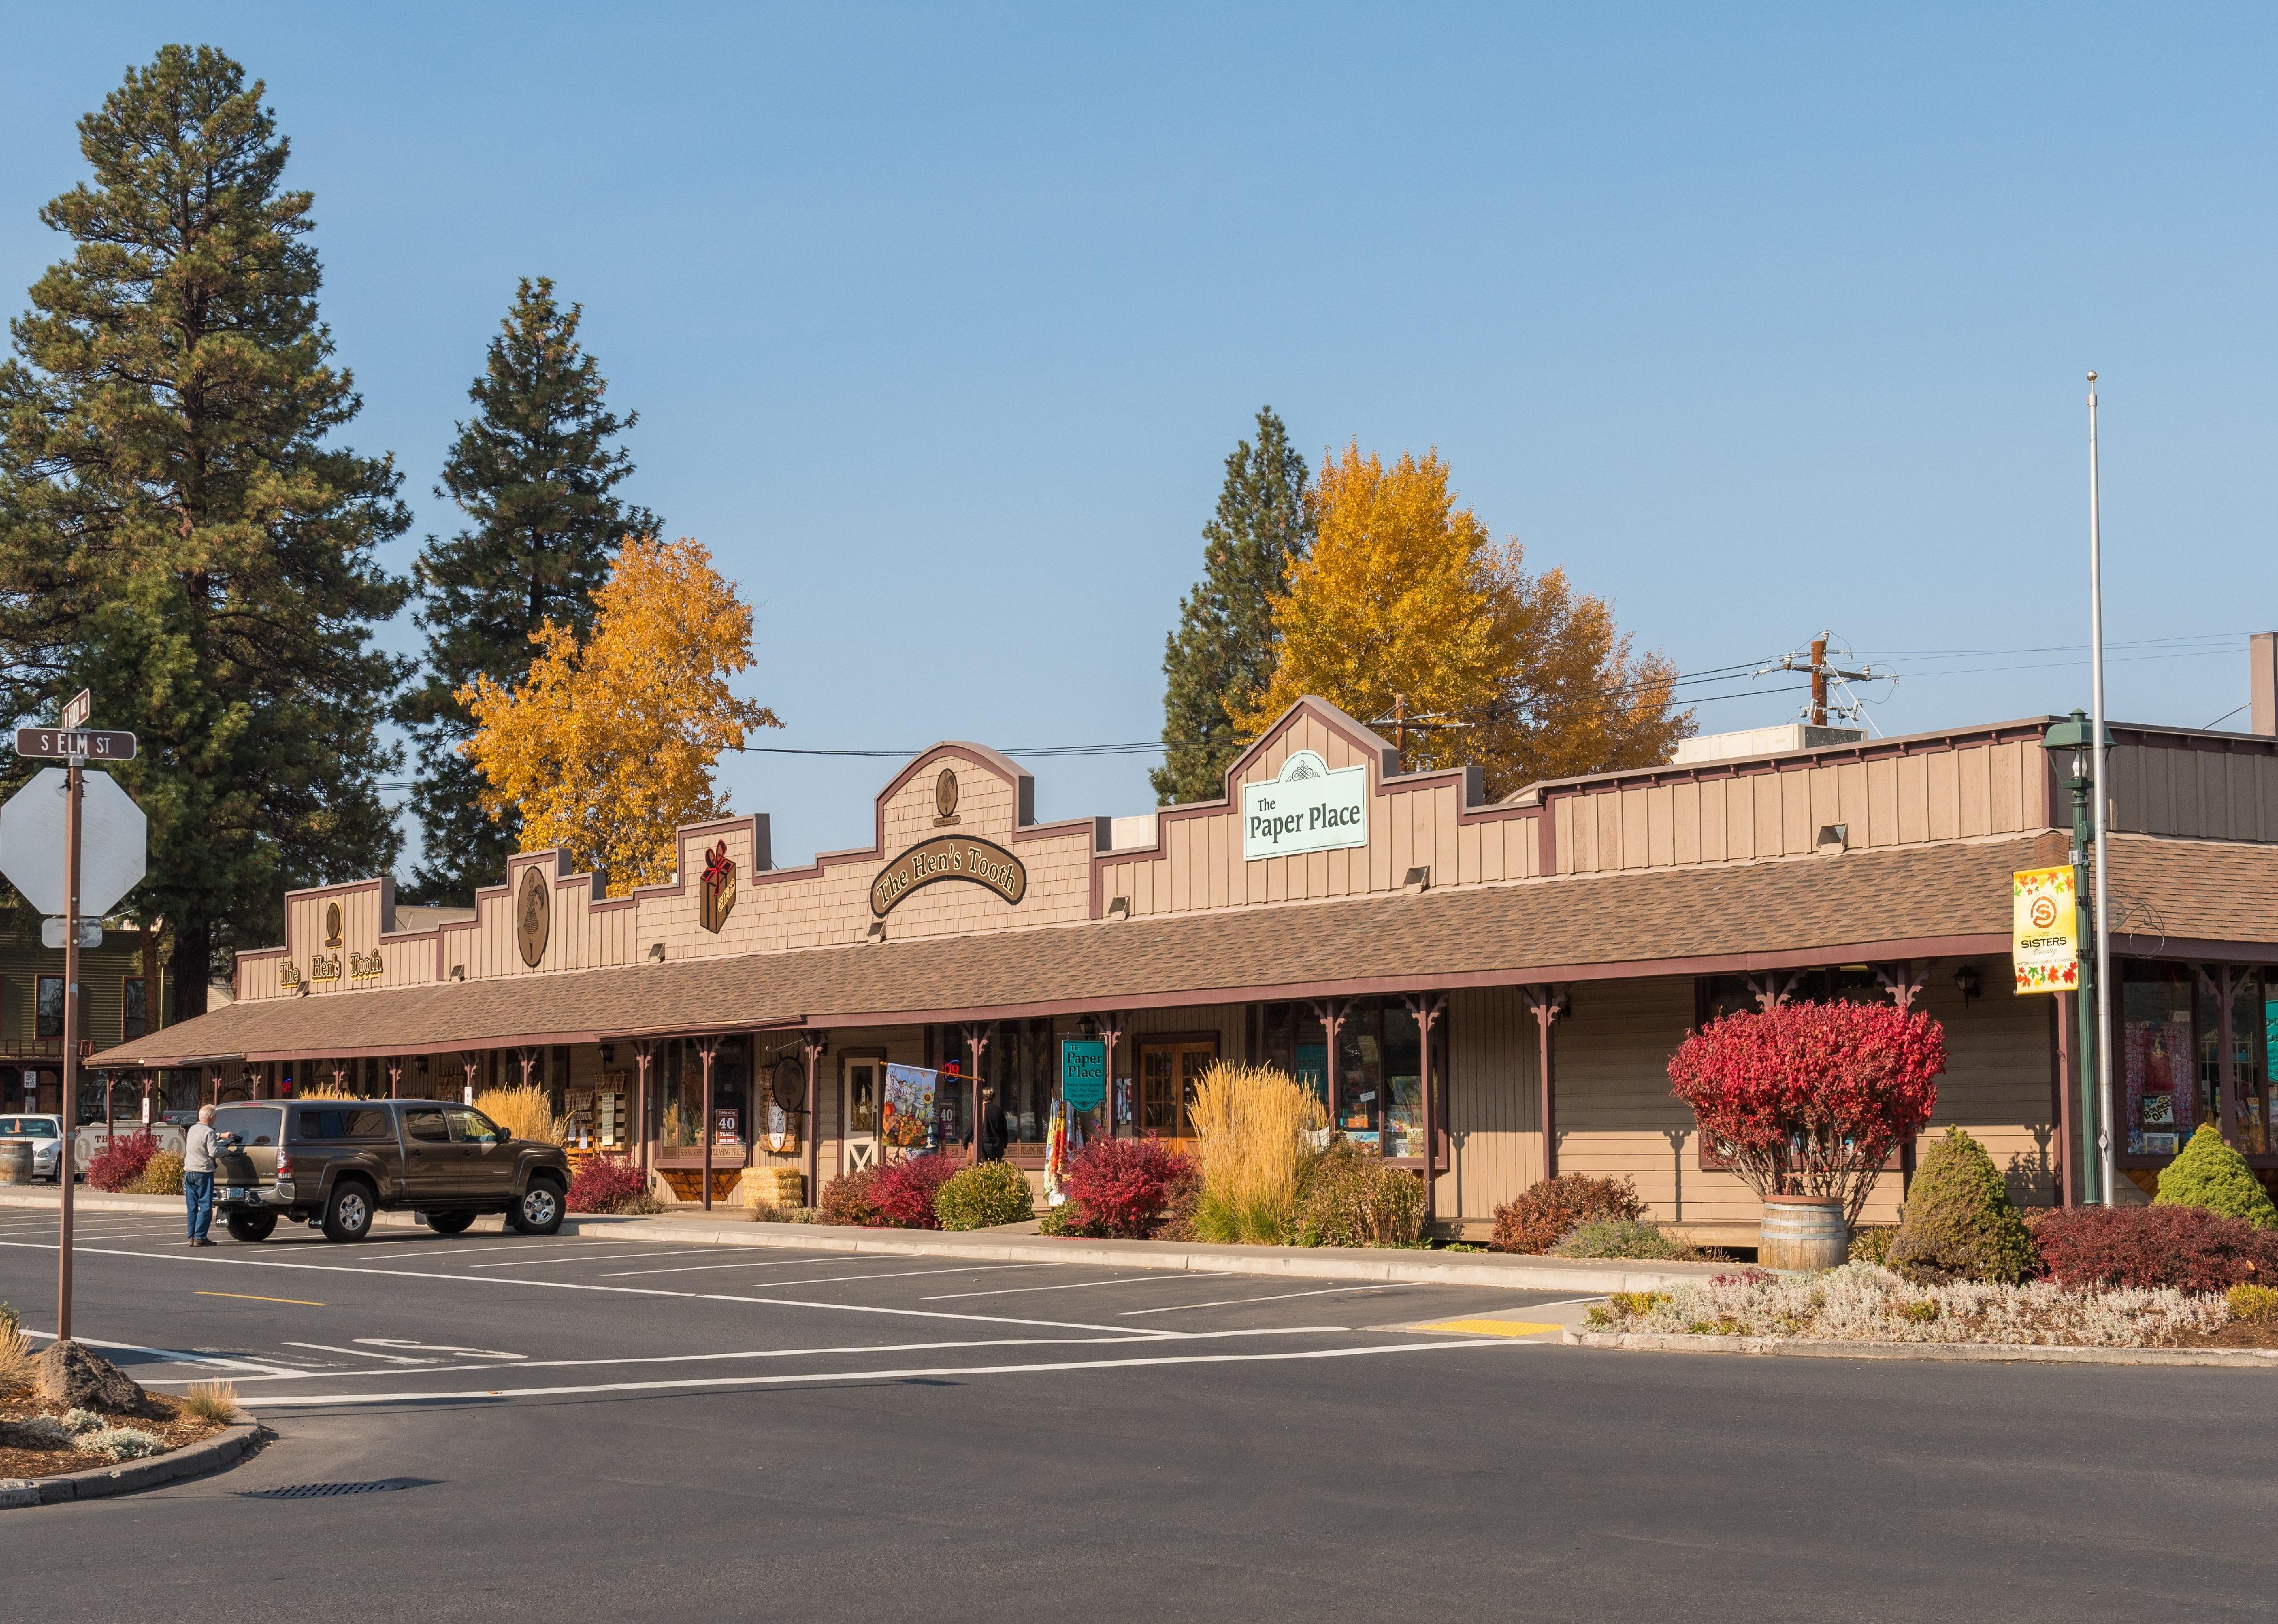
Esteban Martinena Guerrer // Shutterstock
#8. Oregon
Facade of a family business in Sisters, Oregon.
– Share of workers employed by small businesses: 54.4% (893,405)
– Share of businesses that are small: 97.5% (94,568)
– Annual payroll of small businesses: $39.3B (44.9% of state’s private payroll)
– 2022 small business applications through November: 45,738 (33.5% likely to become employers)
RUBEN M RAMOS // Shutterstock
#7. North Dakota
Person working at their handmade gifts store.
– Share of workers employed by small businesses: 55.7% (196,770)
– Share of businesses that are small: 95.2% (18,867)
– Annual payroll of small businesses: $9.1B (49.9% of state’s private payroll)
– 2022 small business applications through November: 7,460 (31.5% likely to become employers)
Monkey Business Images // Shutterstock
#5. Maine (tie)
Interior of busy delicatessen with customers.
– Share of workers employed by small businesses: 56.3% (293,748)
– Share of businesses that are small: 96.6% (33,300)
– Annual payroll of small businesses: $12.0B (49.7% of state’s private payroll)
– 2022 small business applications through November: 11,974 (37.0% likely to become employers)
Jess Kraft // Shutterstock
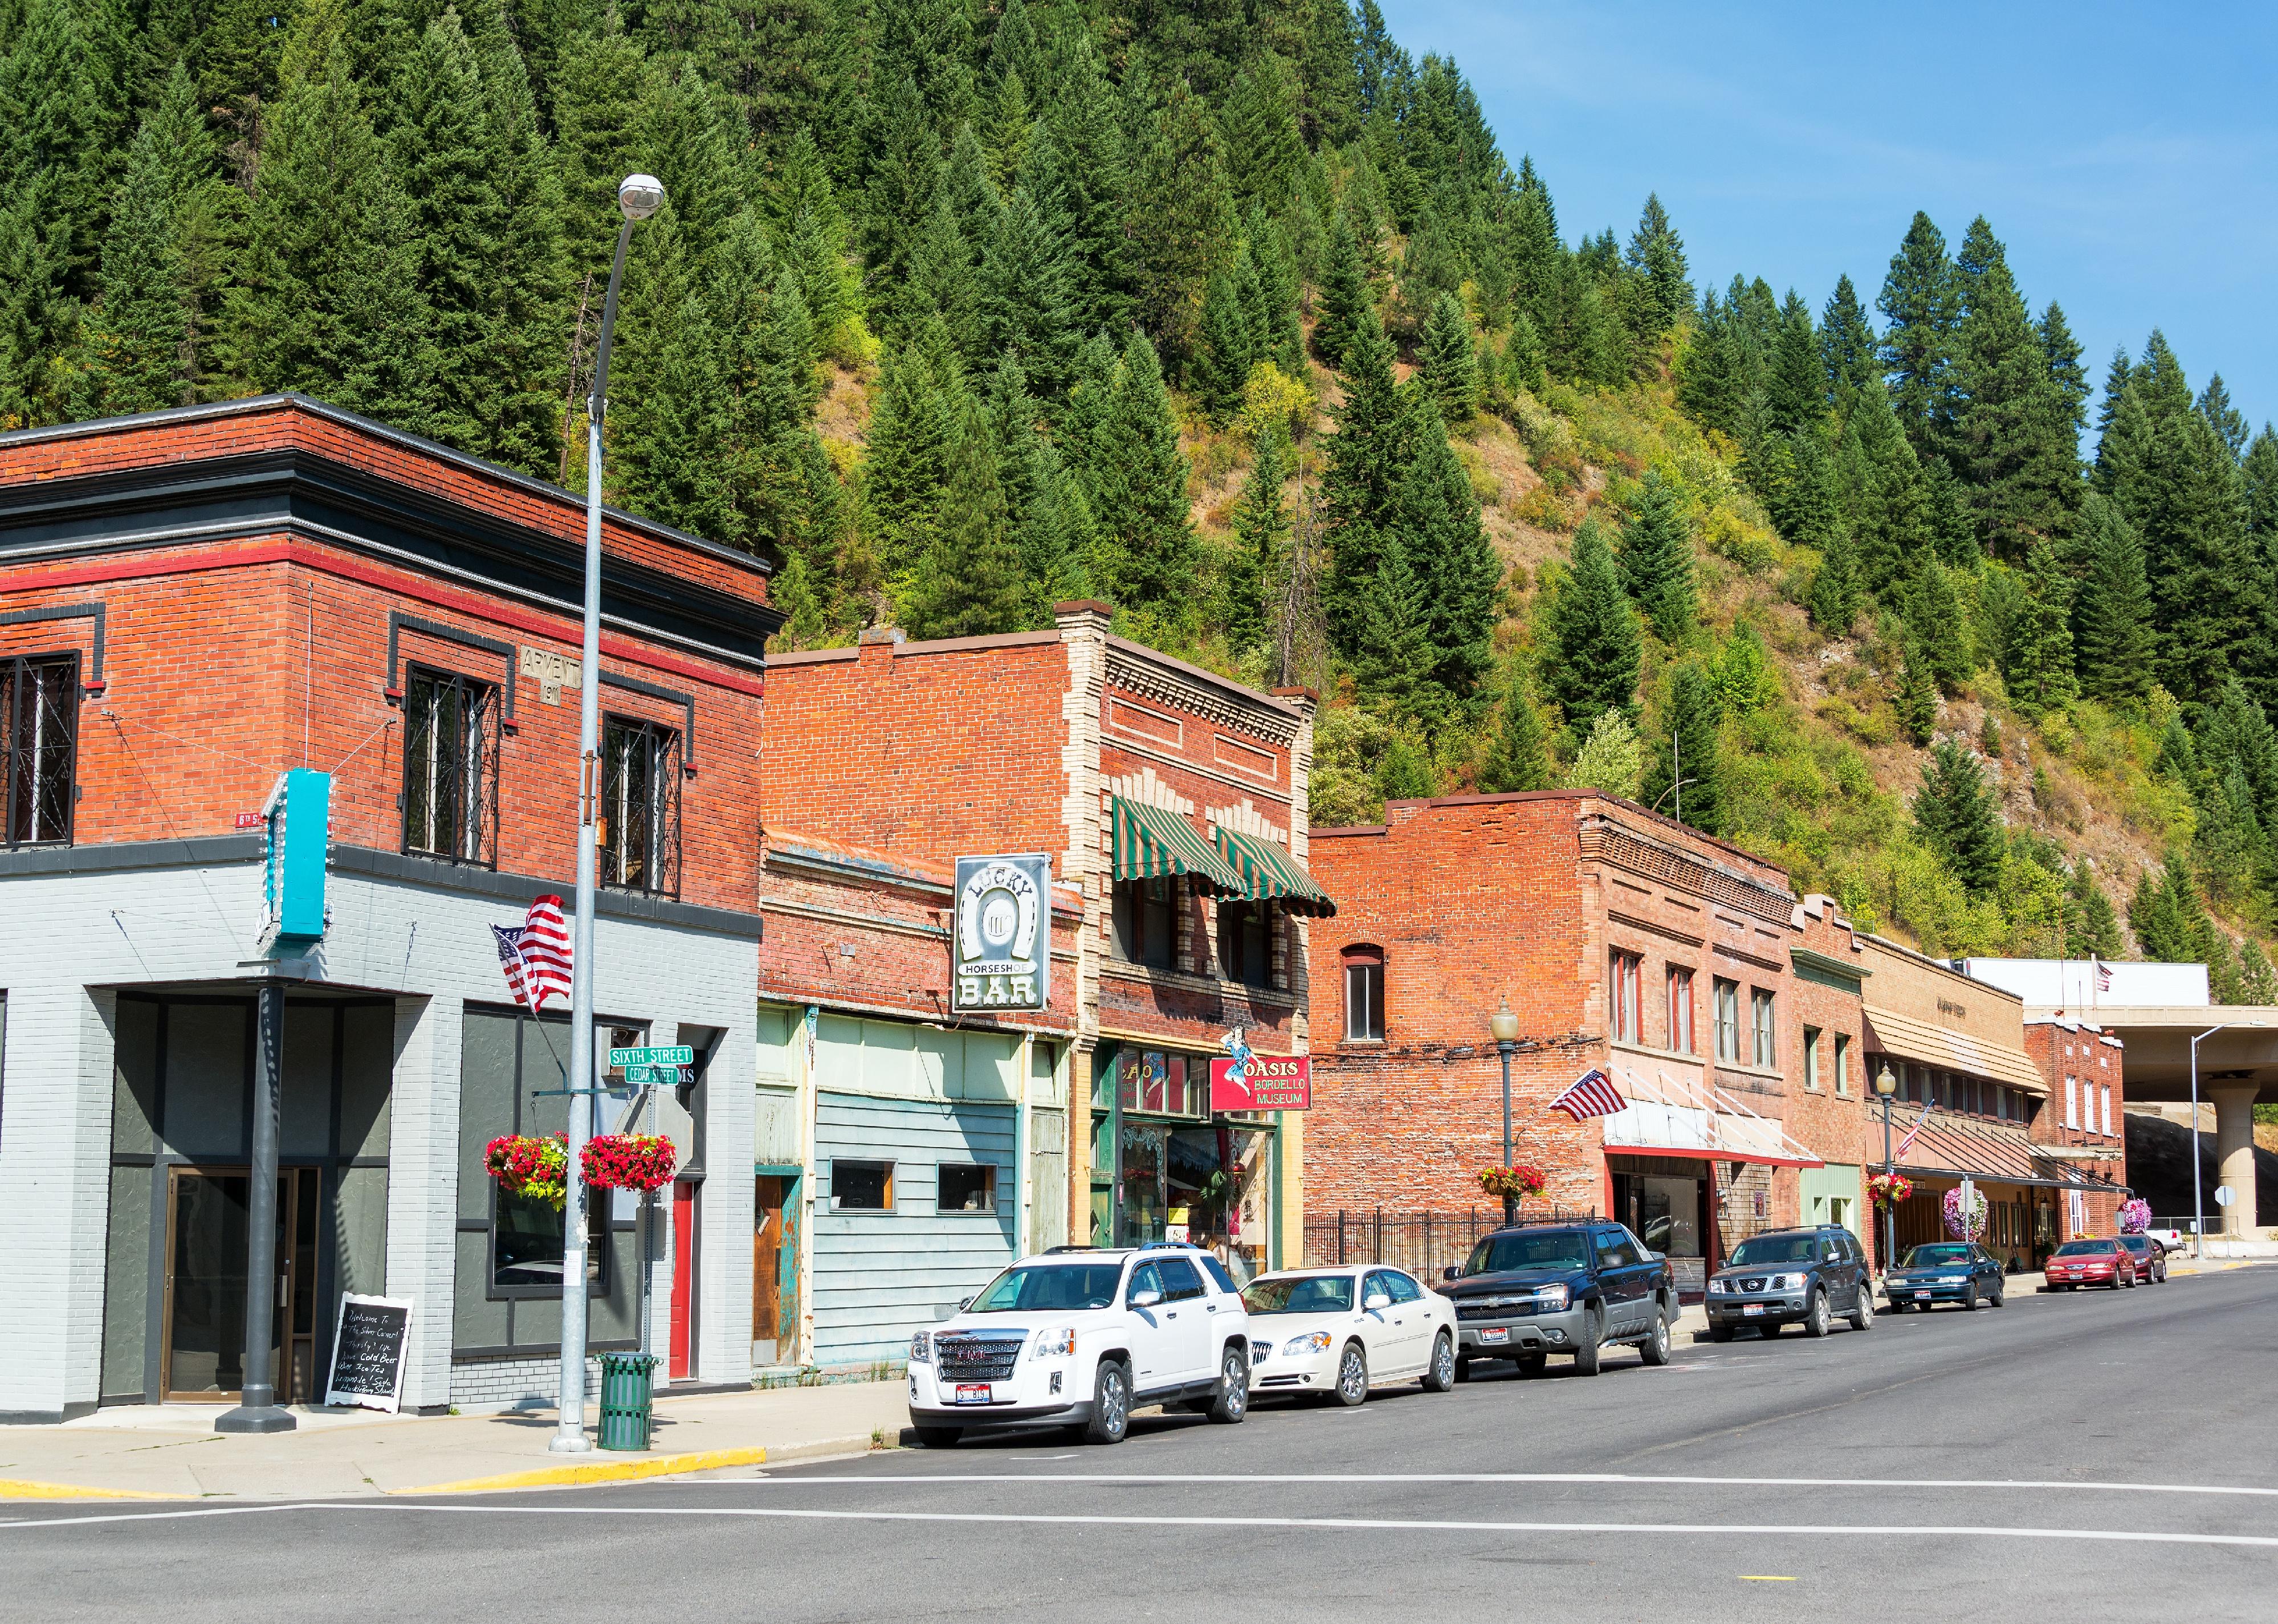
#5. Idaho (tie)
Historic main street and shops in Wallace, Idaho.
– Share of workers employed by small businesses: 56.3% (347,193)
– Share of businesses that are small: 96.6% (41,174)
– Annual payroll of small businesses: $13.1B (48.4% of state’s private payroll)
– 2022 small business applications through November: 27,513 (32.8% likely to become employers)

DGLimages // Shutterstock
#4. South Dakota
Close up of a card payment being made in a cafe.
– Share of workers employed by small businesses: 58.0% (208,353)
– Share of businesses that are small: 95.8% (21,473)
– Annual payroll of small businesses: $8.0B (51.0% of state’s private payroll)
– 2022 small business applications through November: 9,695 (32.5% likely to become employers)
James Kirkikis // Shutterstock
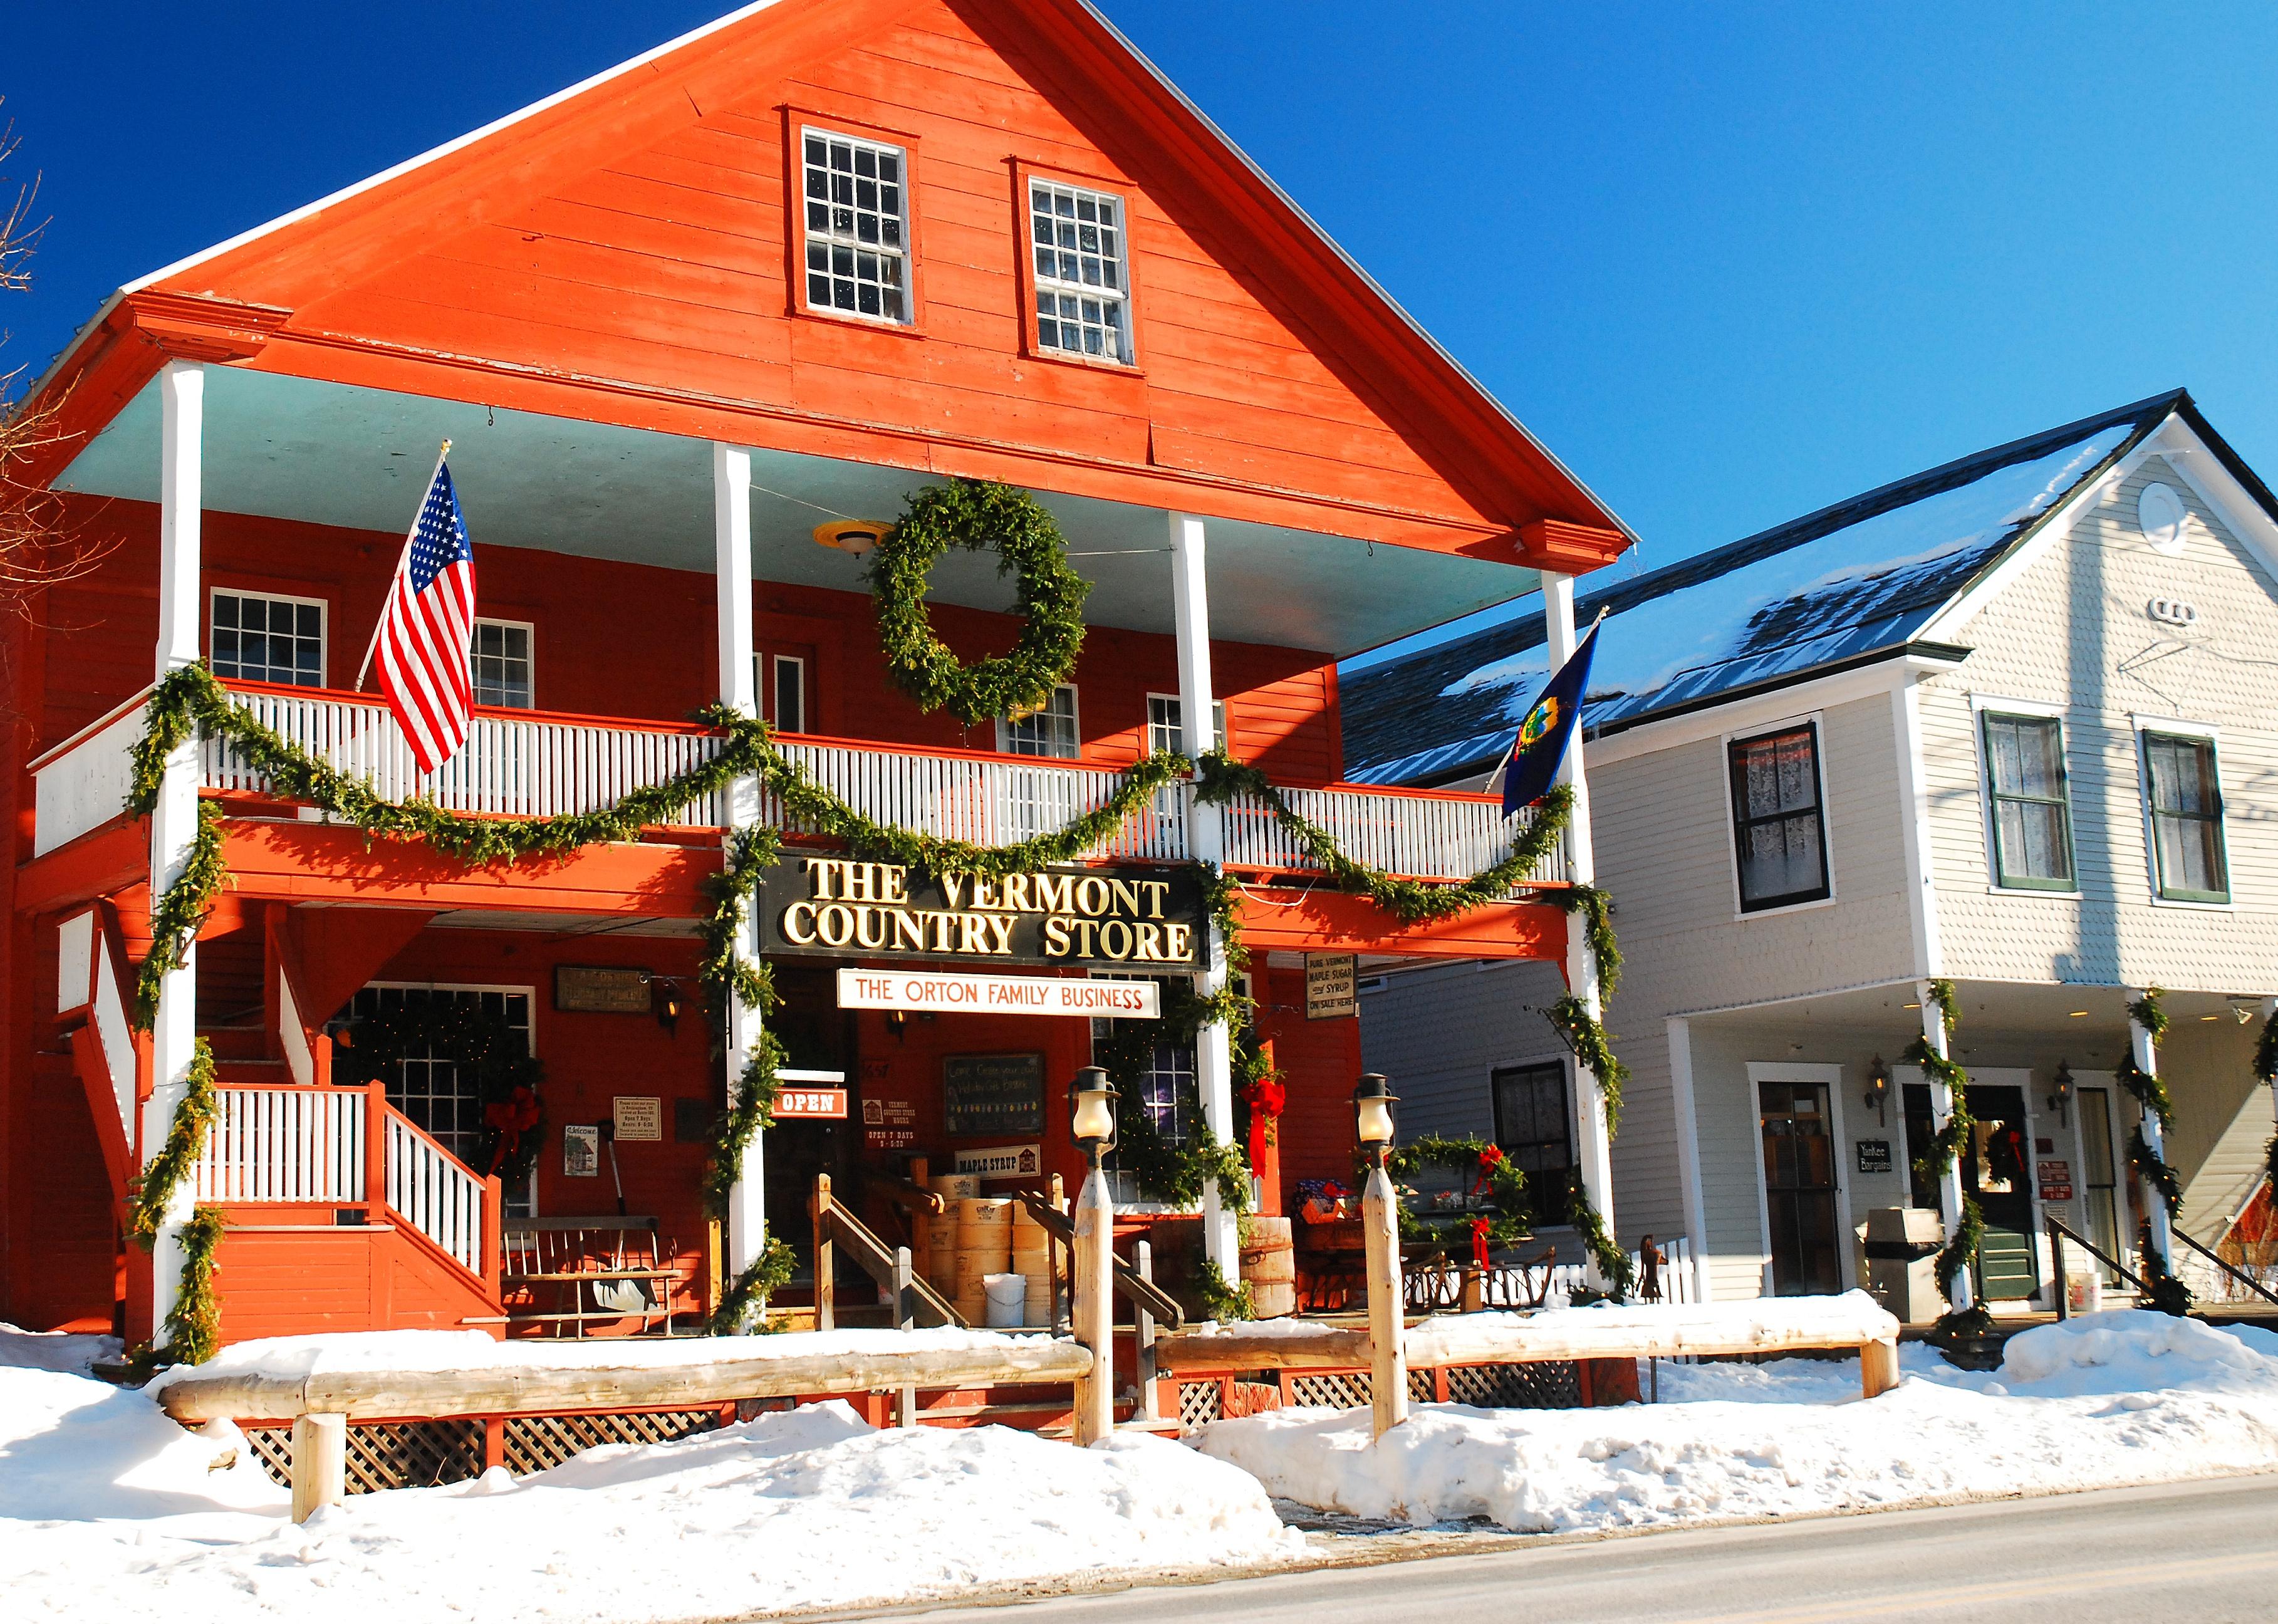
#3. Vermont
Exterior of The Vermont Country Store.
– Share of workers employed by small businesses: 60.2% (157,131)
– Share of businesses that are small: 95.6% (16,962)
– Annual payroll of small businesses: $6.7B (56.3% of state’s private payroll)
– 2022 small business applications through November: 6,938 (33.6% likely to become employers)

Yuganov Konstantin // Shutterstock
#2. Wyoming
Person working in a textile based small business.
– Share of workers employed by small businesses: 64.1% (132,595)
– Share of businesses that are small: 95.6% (17,777)
– Annual payroll of small businesses: $5.9B (56.6% of state’s private payroll)
– 2022 small business applications through November: 37,992 (21.9% likely to become employers)
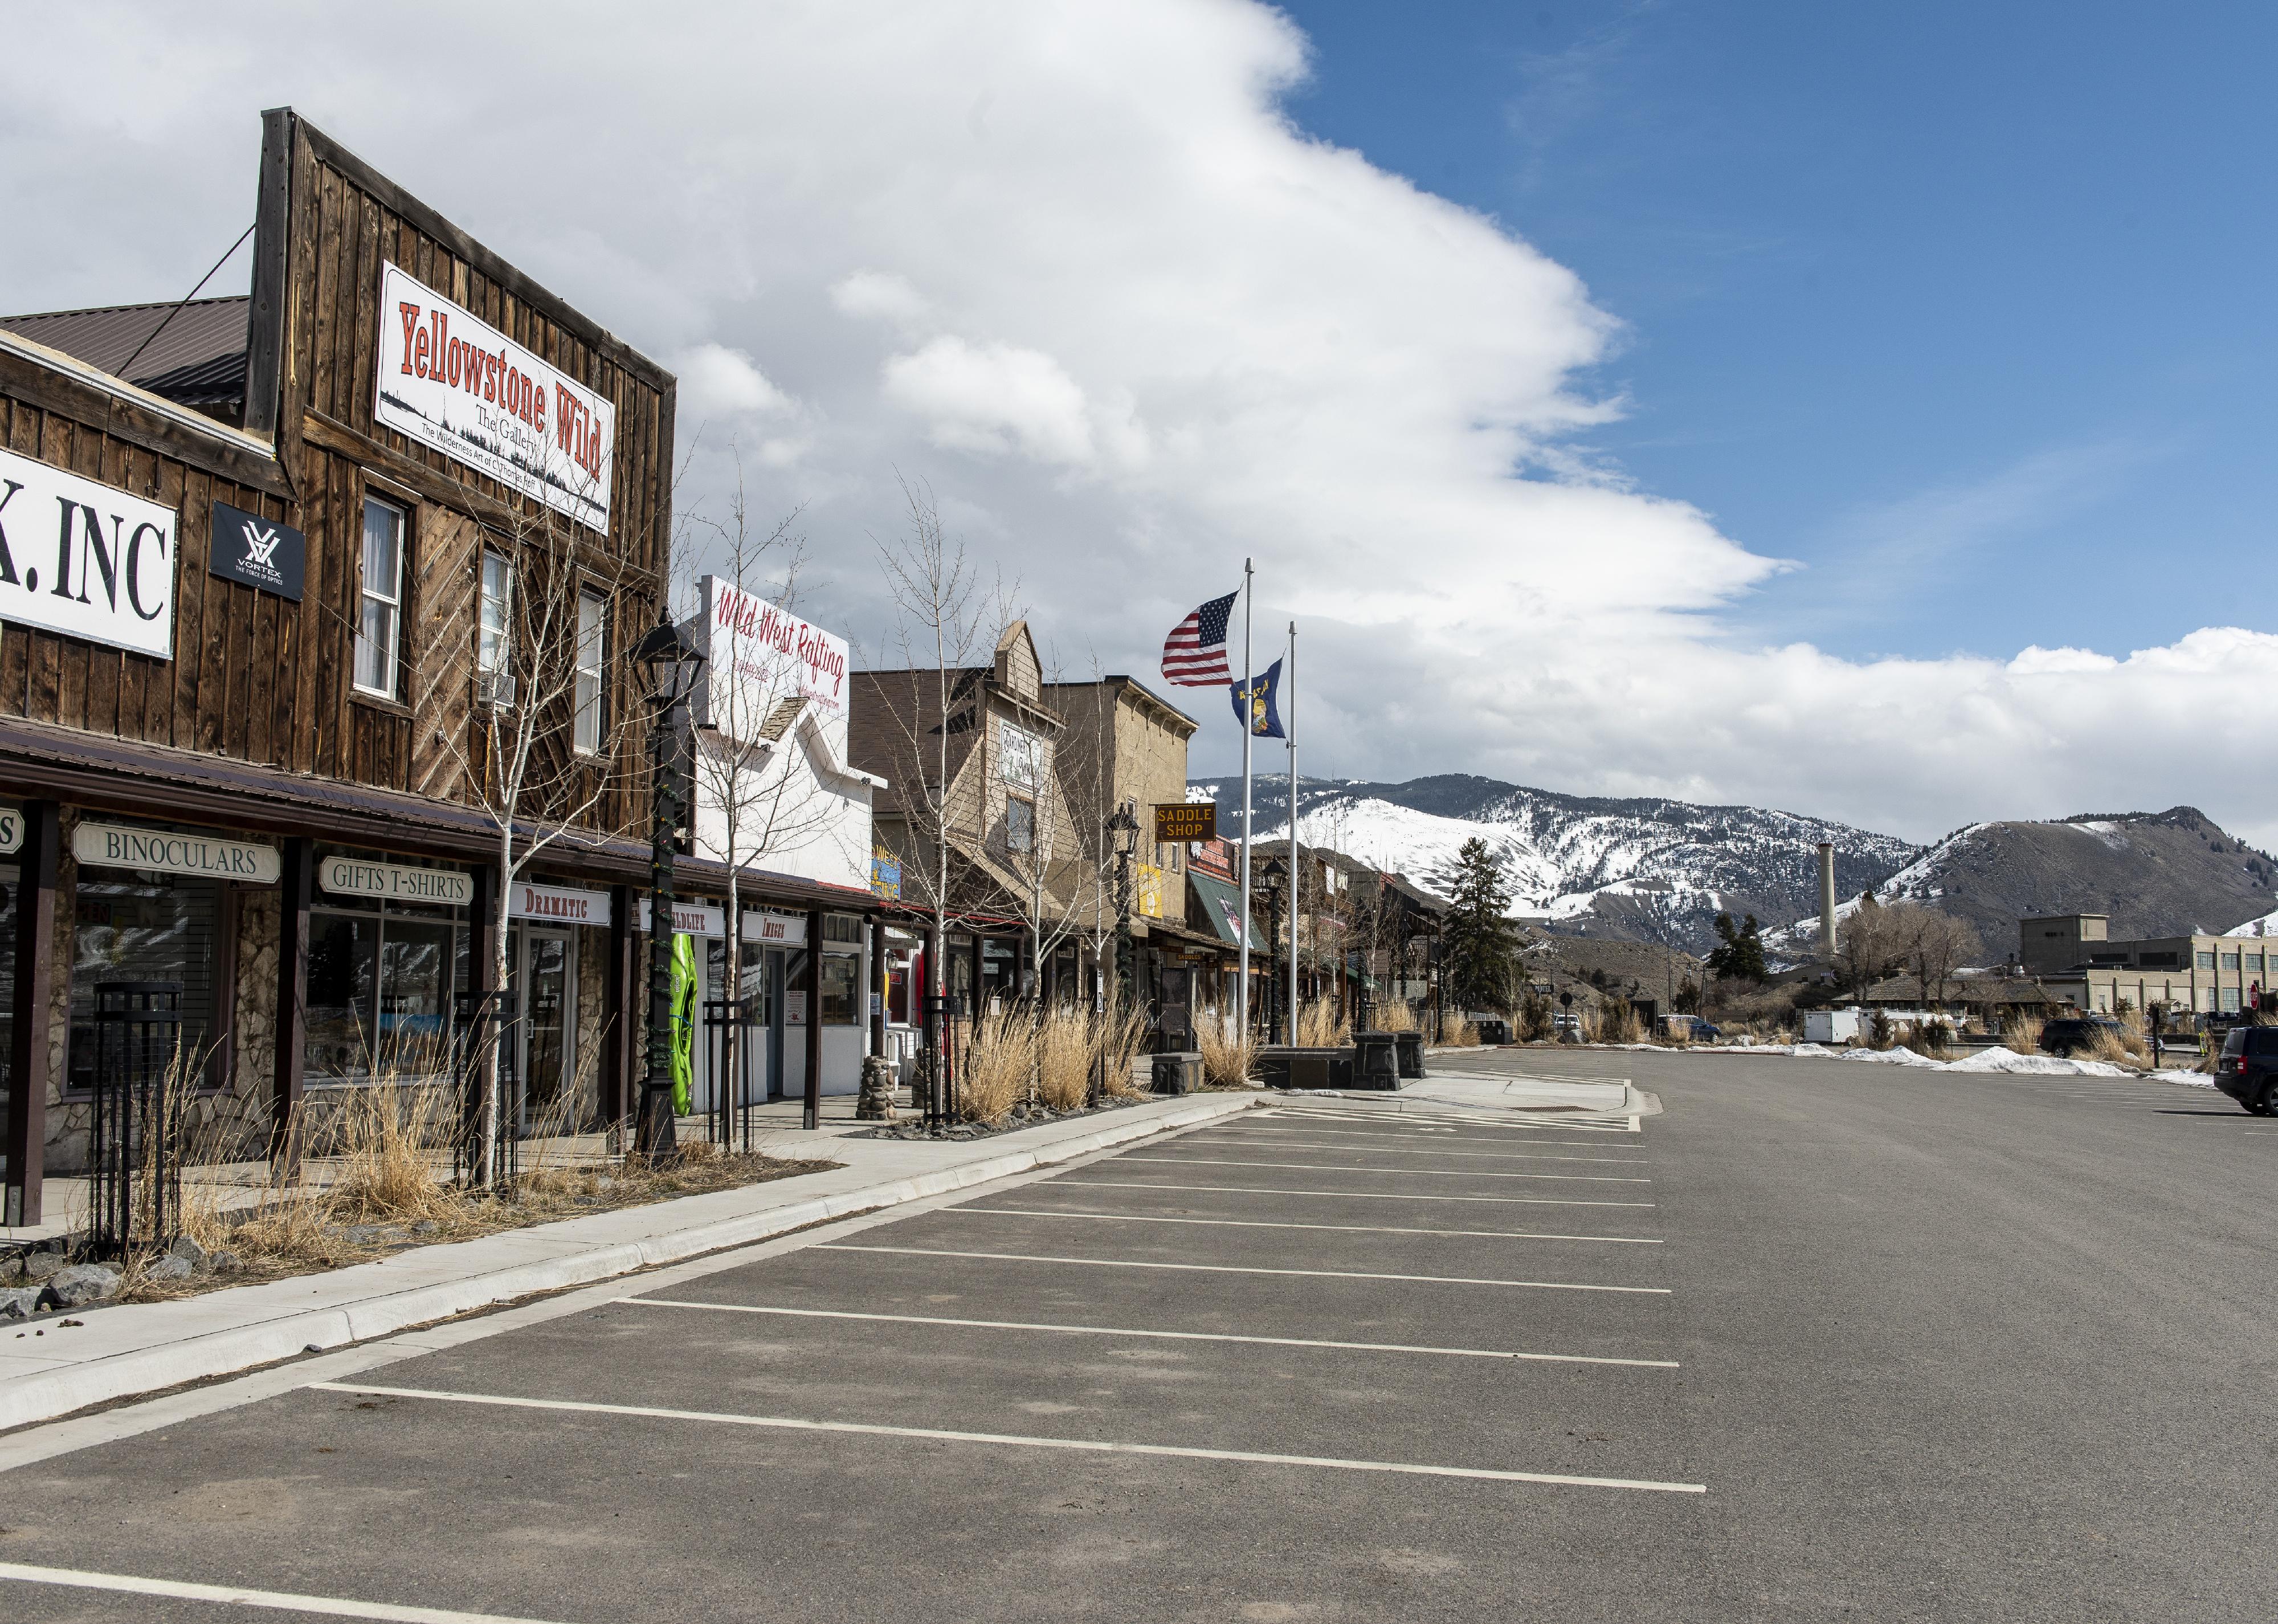
William Campbell // Getty Images
#1. Montana
Small tourist shops in Gardiner, Montana.
– Share of workers employed by small businesses: 66.8% (250,680)
– Share of businesses that are small: 97.2% (32,614)
– Annual payroll of small businesses: $9.6B (60.1% of state’s private payroll)
– 2022 small business applications through November: 19,064 (31.3% likely to become employers)
This story originally appeared on Swyft Filings and was produced and
distributed in partnership with Stacker Studio.