Counties with the biggest percentage drop in population in each state

Canva
Counties with the biggest percentage drop in population in each state
Aerial view of downtown Pittsfield, Massachusetts
Stacker
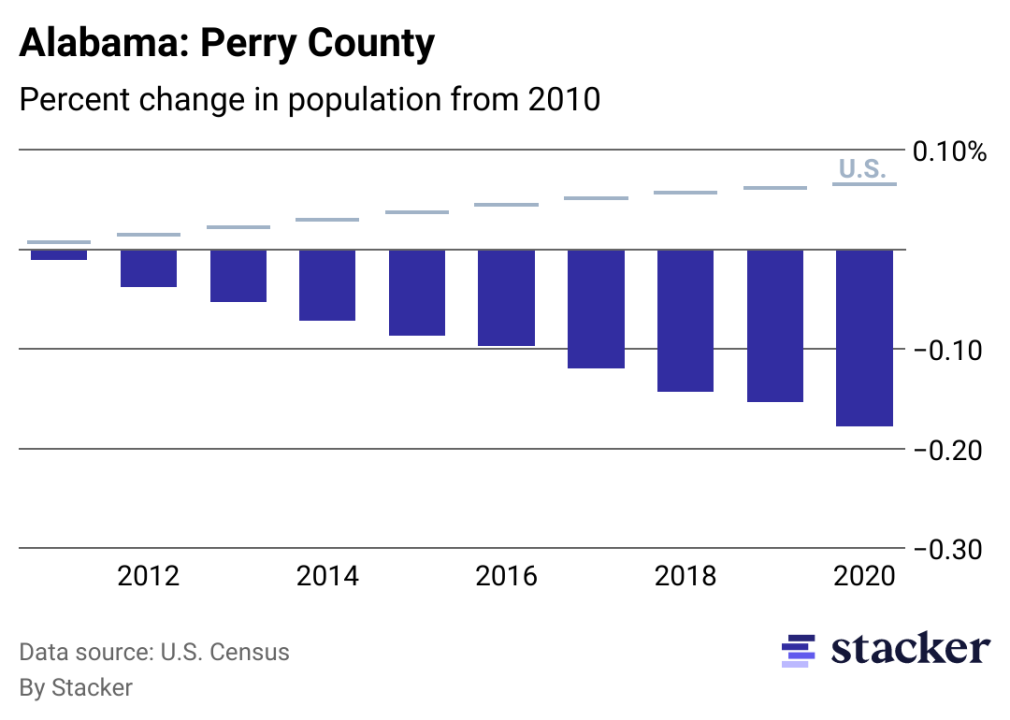
Alabama: Perry County
Chart showing 17.77% population decrease from 2010 to 2020 for Perry County, Alabama, compared to overall population increase for the U.S.
Stacker
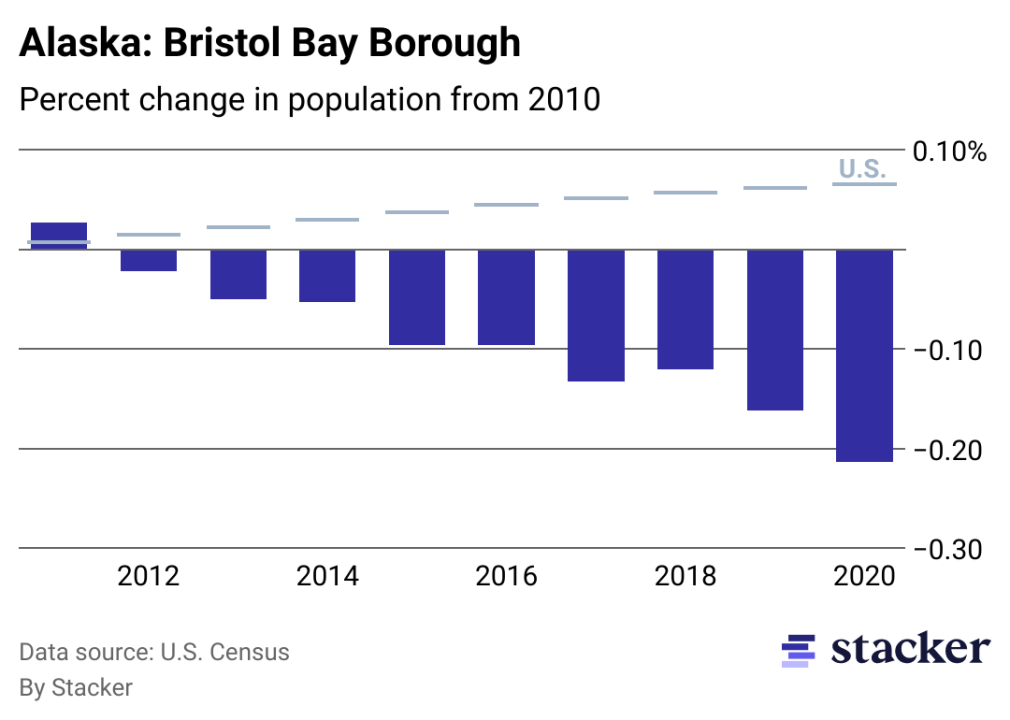
Alaska: Bristol Bay Borough
Chart showing 21.36% population decrease from 2010 to 2020 for Bristol Bay Borough, Alaska, compared to overall population increase for the U.S.
Stacker
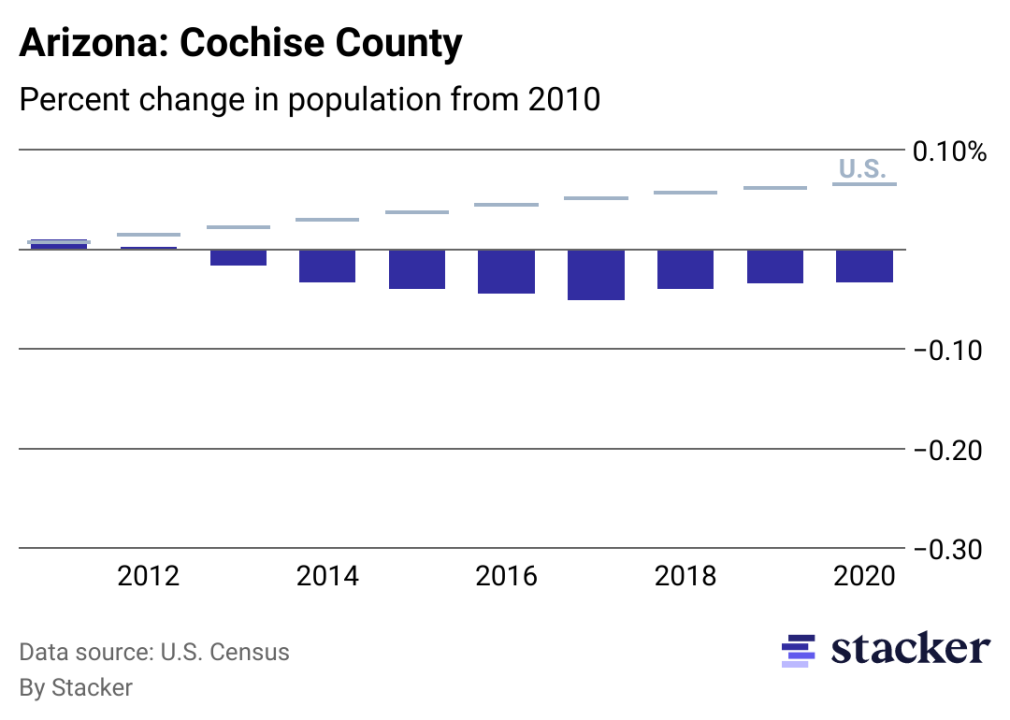
Arizona: Cochise County
Chart showing 3.32% population decrease from 2010 to 2020 for Cochise County, Arizona, compared to overall population increase for the U.S.
Stacker
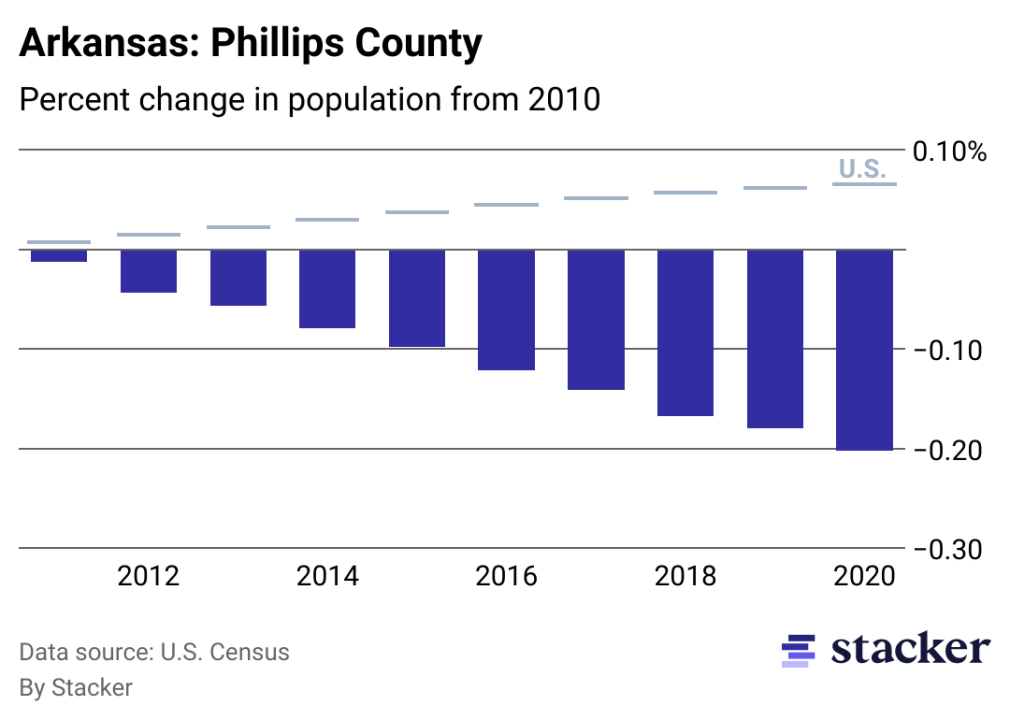
Arkansas: Phillips County
Chart showing 20.19% population decrease from 2010 to 2020 for Phillips County, Arkansas, compared to overall population increase for the U.S.
Stacker
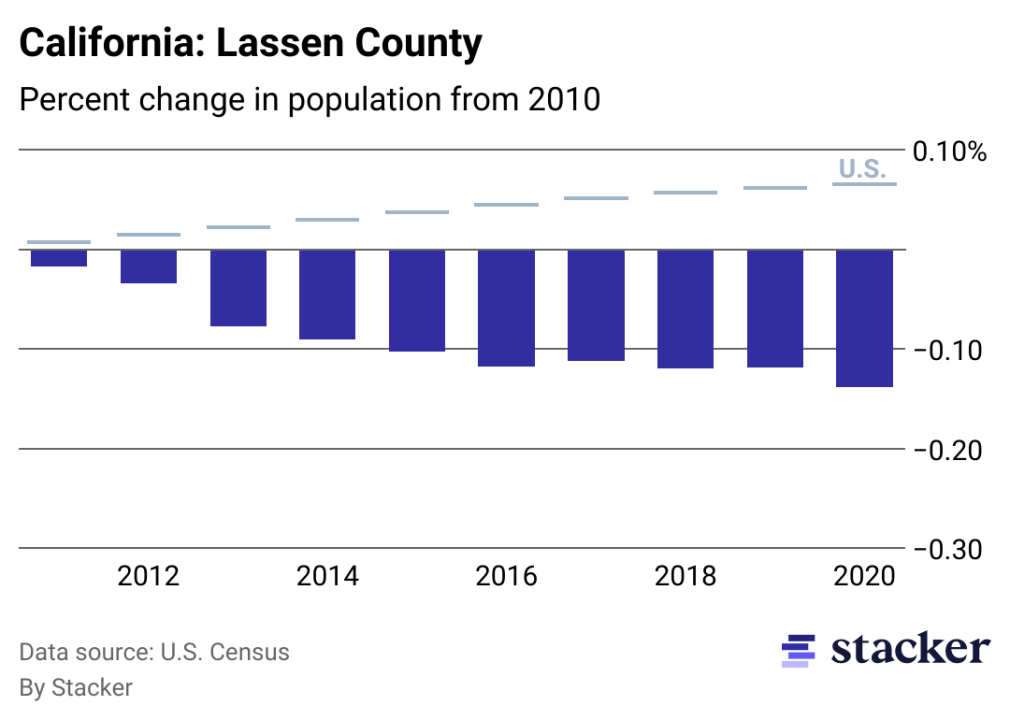
California: Lassen County
Chart showing 13.82% population decrease from 2010 to 2020 for Lassen County, California, compared to overall population increase for the U.S.
Stacker
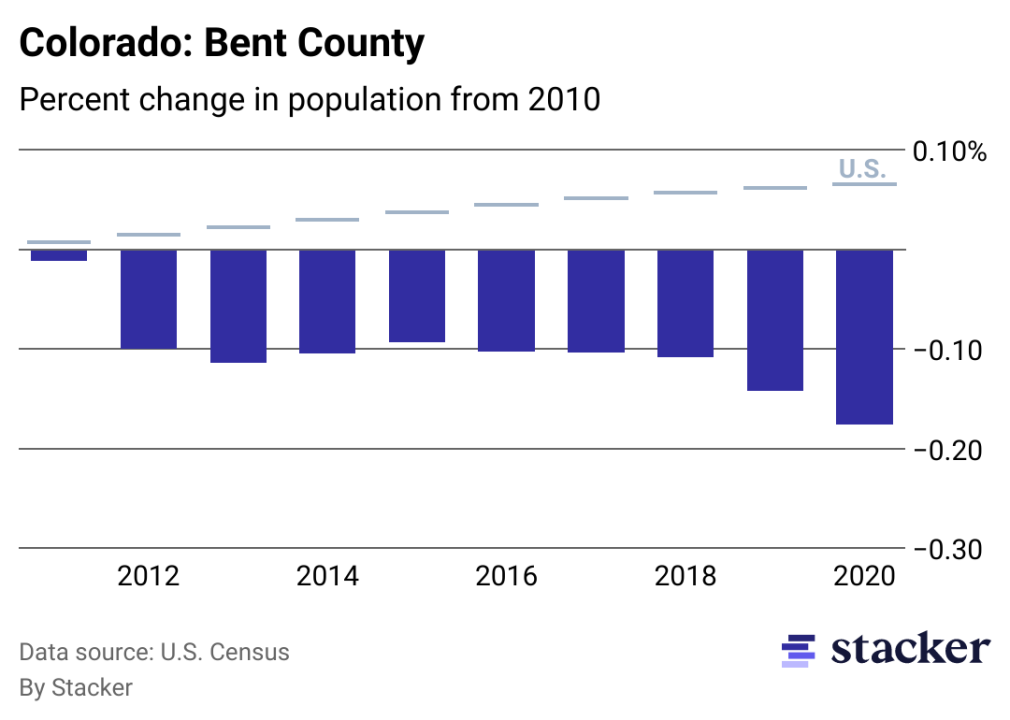
Colorado: Bent County
Chart showing 17.60% population decrease from 2010 to 2020 for Bent County, Colorado, compared to overall population increase for the U.S.
Stacker
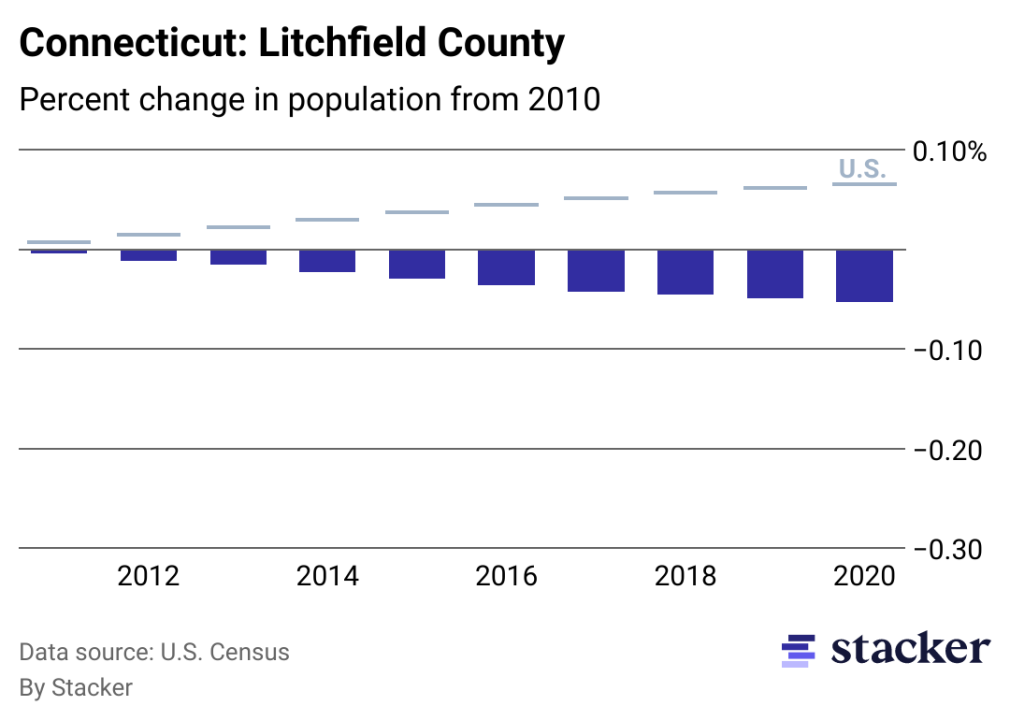
Connecticut: Litchfield County
Chart showing 5.35% population decrease from 2010 to 2020 for Litchfield County, Connecticut, compared to overall population increase for the U.S.
Stacker
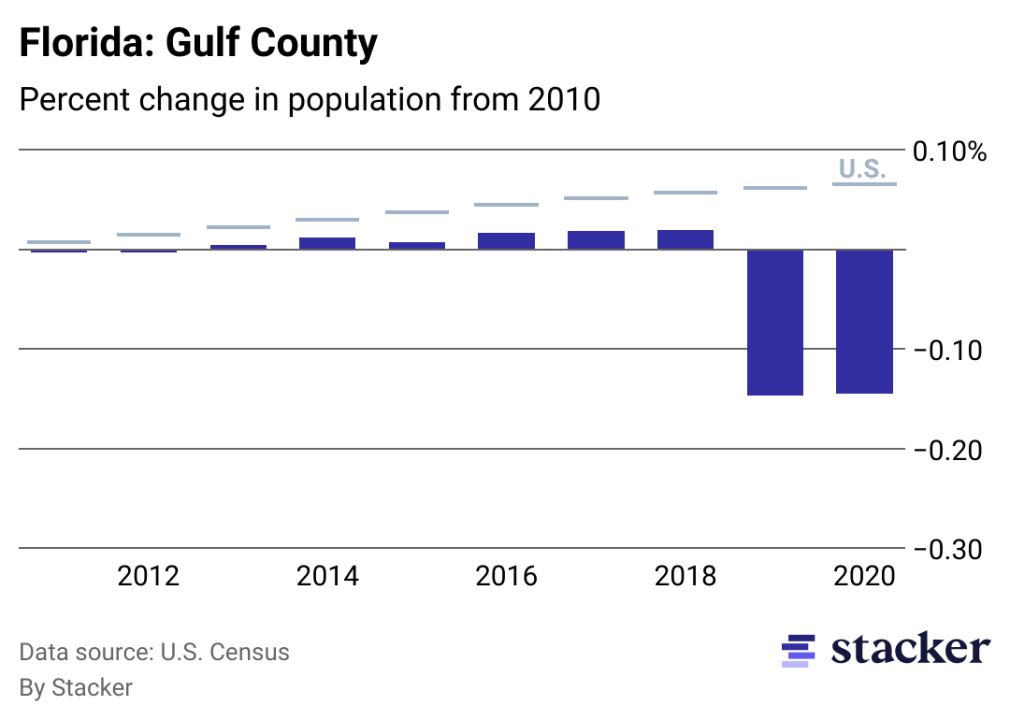
Florida: Gulf County
Chart showing 14.48% population decrease from 2010 to 2020 for Gulf County, Florida, compared to overall population increase for the U.S.

Stacker
Georgia: Baker County
Chart showing 13.41% population decrease from 2010 to 2020 for Baker County, Georgia, compared to overall population increase for the U.S.
Stacker
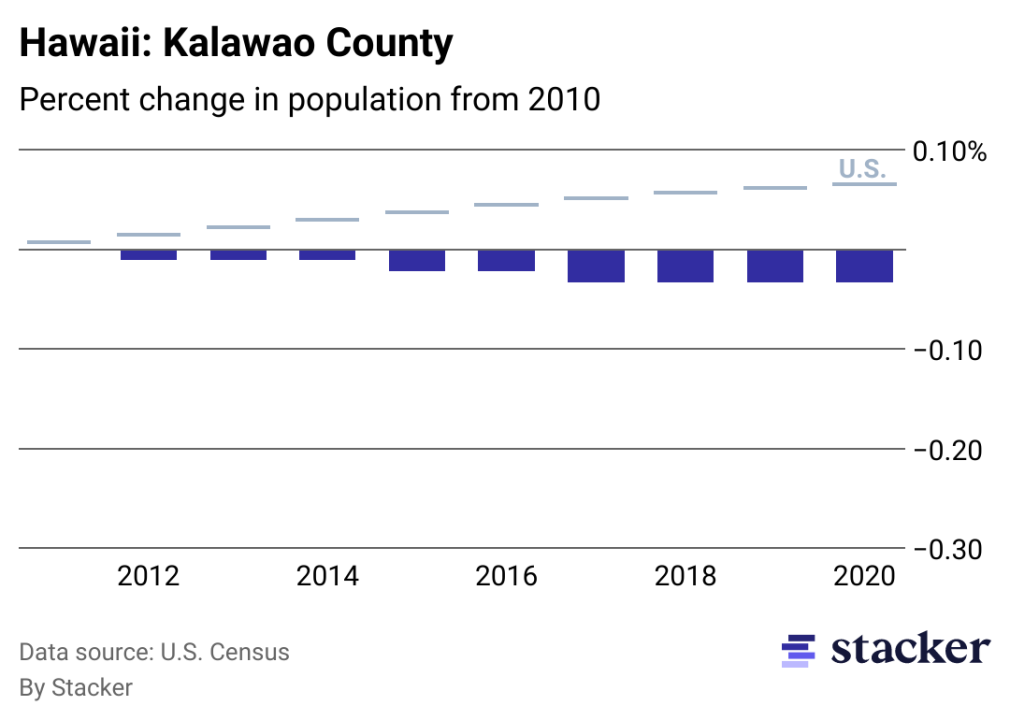
Hawaii: Kalawao County
Chart showing 3.33% population decrease from 2010 to 2020 for Kalawao County, Hawaii, compared to overall population increase for the U.S.
Stacker
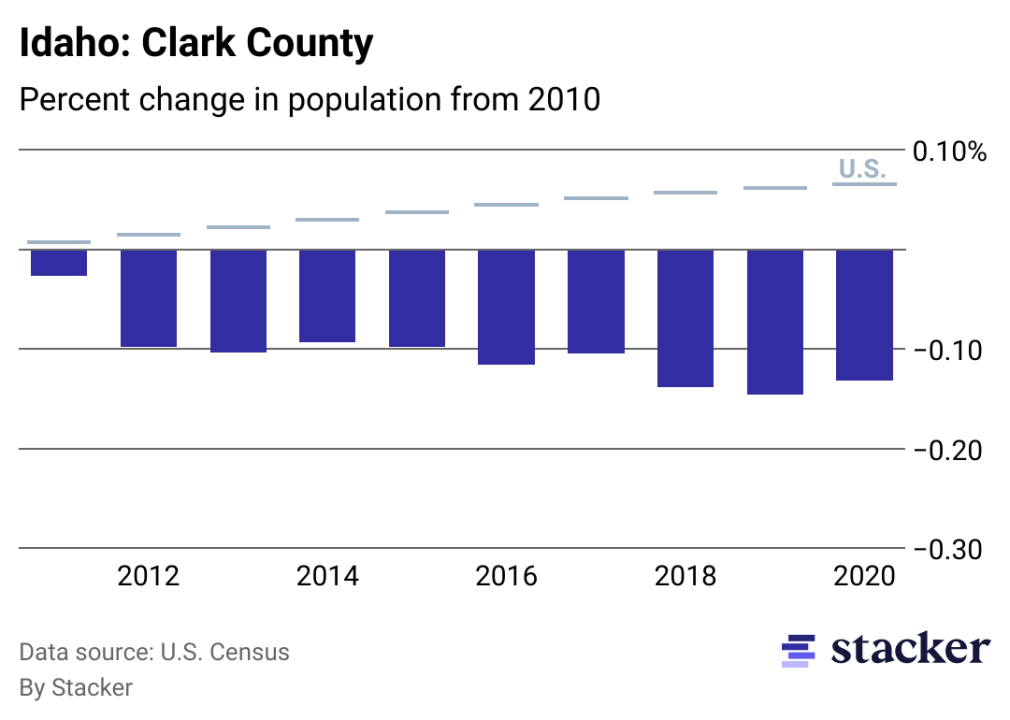
Idaho: Clark County
Chart showing 13.15% population decrease from 2010 to 2020 for Clark County, Idaho, compared to overall population increase for the U.S.
Stacker
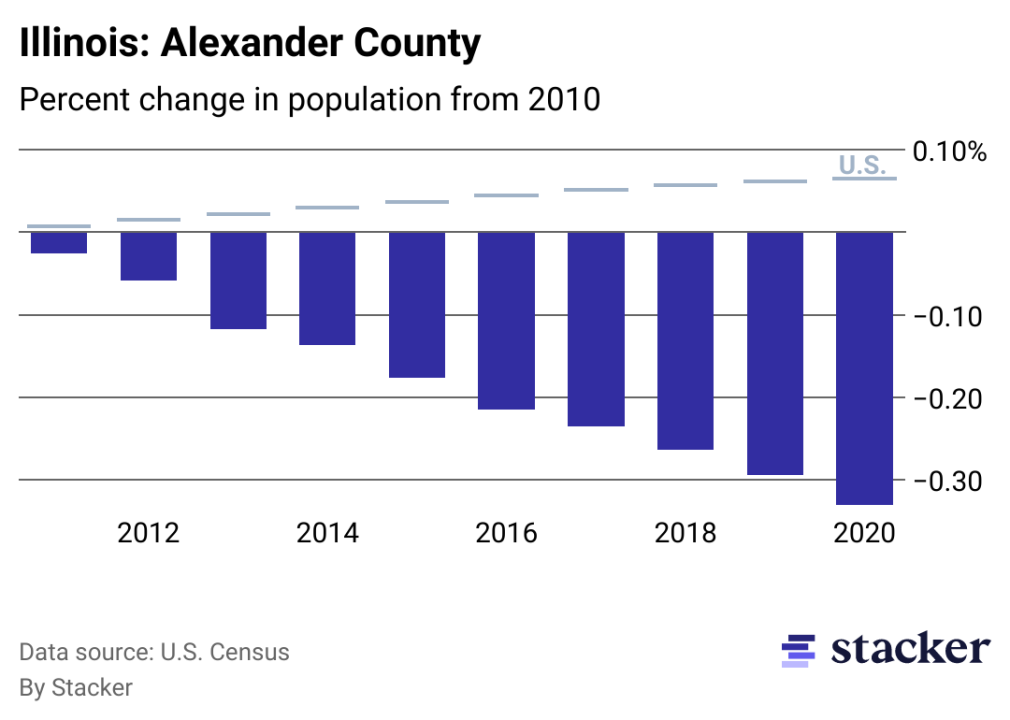
Illinois: Alexander County
Chart showing 33.00% population decrease from 2010 to 2020 for Alexander County, Illinois, compared to overall population increase for the U.S.
Stacker
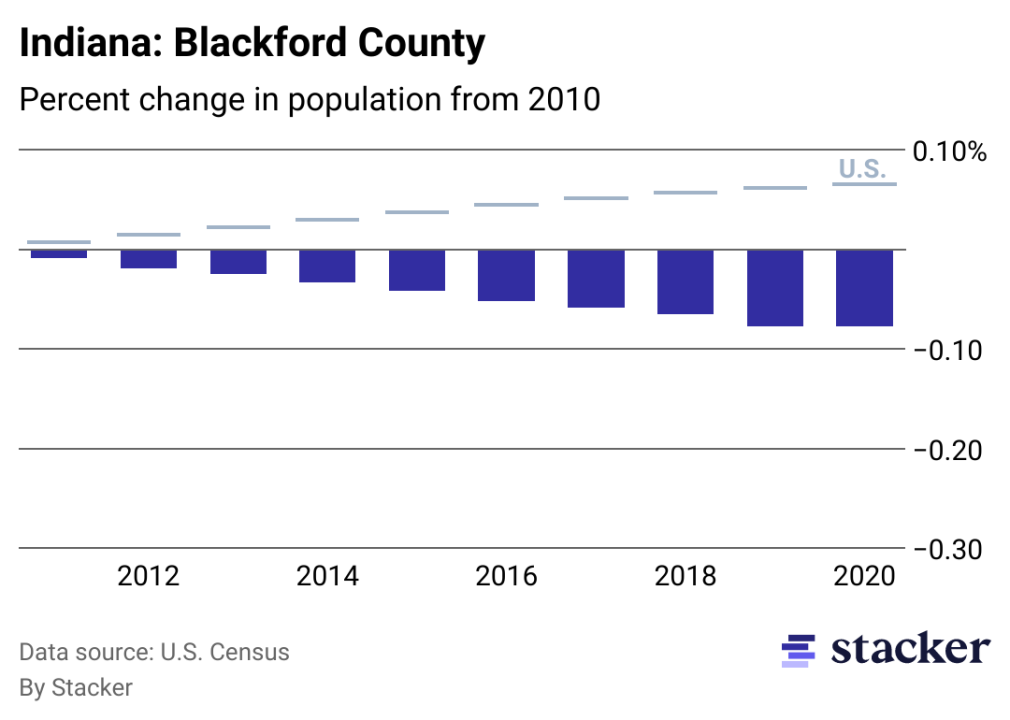
Indiana: Blackford County
Chart showing 7.74% population decrease from 2010 to 2020 for Blackford County, Indiana, compared to overall population increase for the U.S.
Stacker
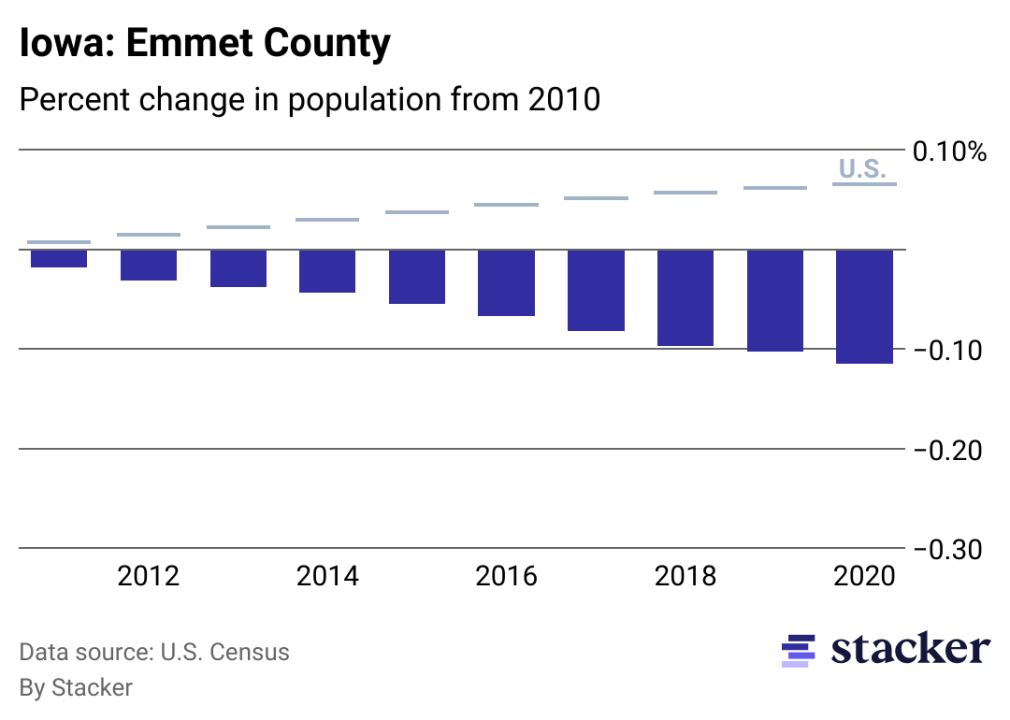
Iowa: Emmet County
Chart showing 11.50% population decrease from 2010 to 2020 for Emmet County, Iowa, compared to overall population increase for the U.S.
Stacker
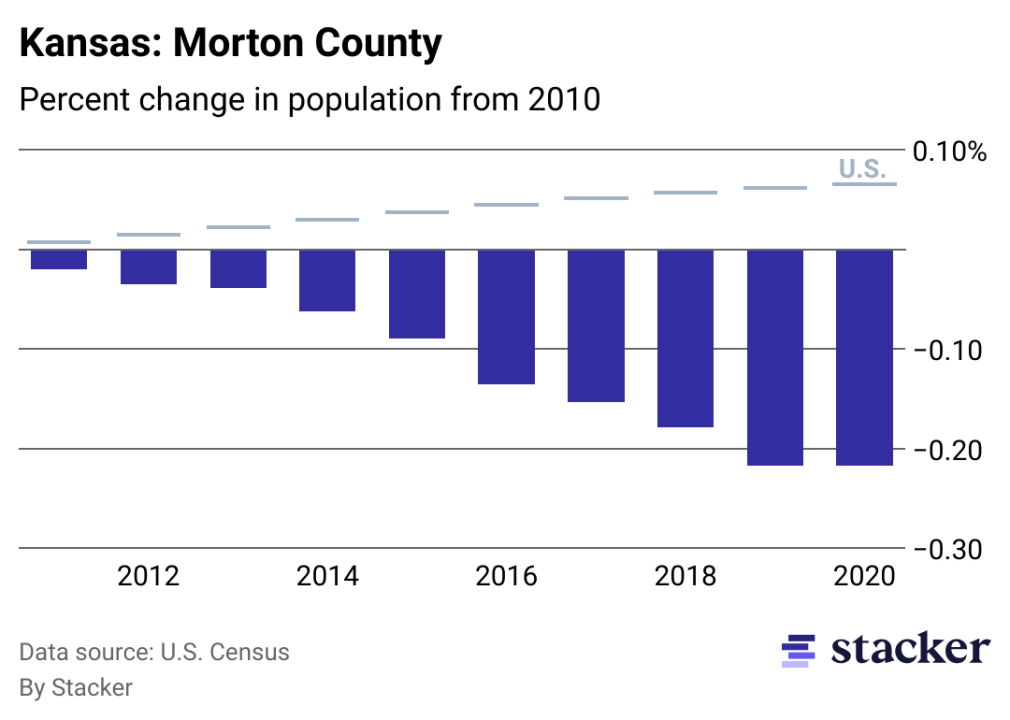
Kansas: Morton County
Chart showing 21.69% population decrease from 2010 to 2020 for Morton County, Kansas, compared to overall population increase for the U.S.
Stacker
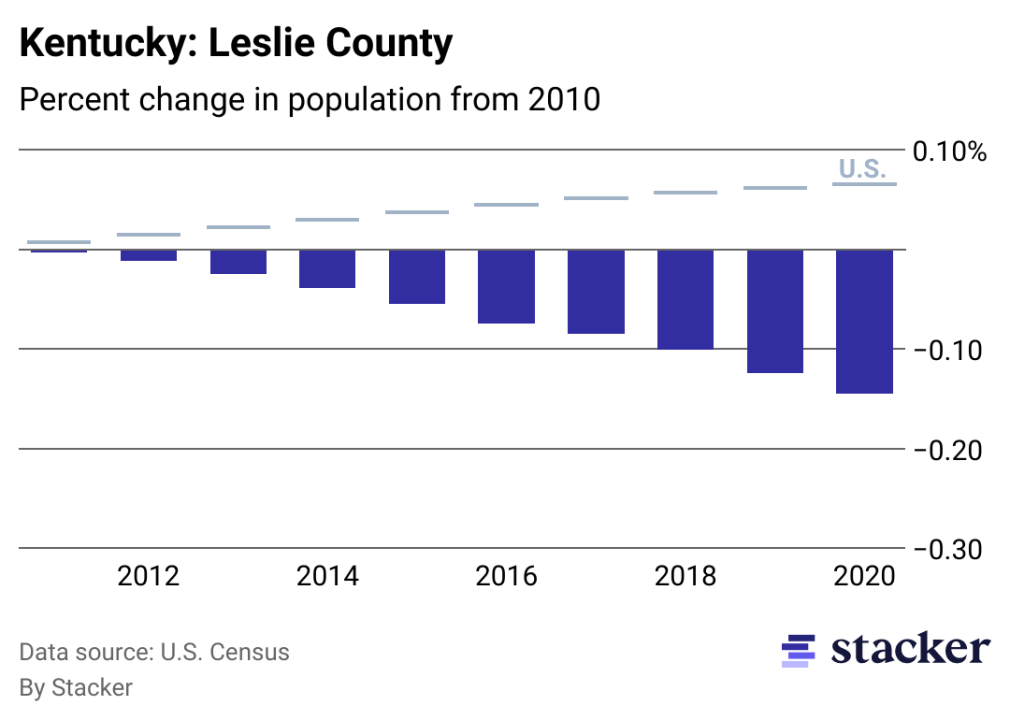
Kentucky: Leslie County
Chart showing 14.55% population decrease from 2010 to 2020 for Leslie County, Kentucky, compared to overall population increase for the U.S.
Stacker
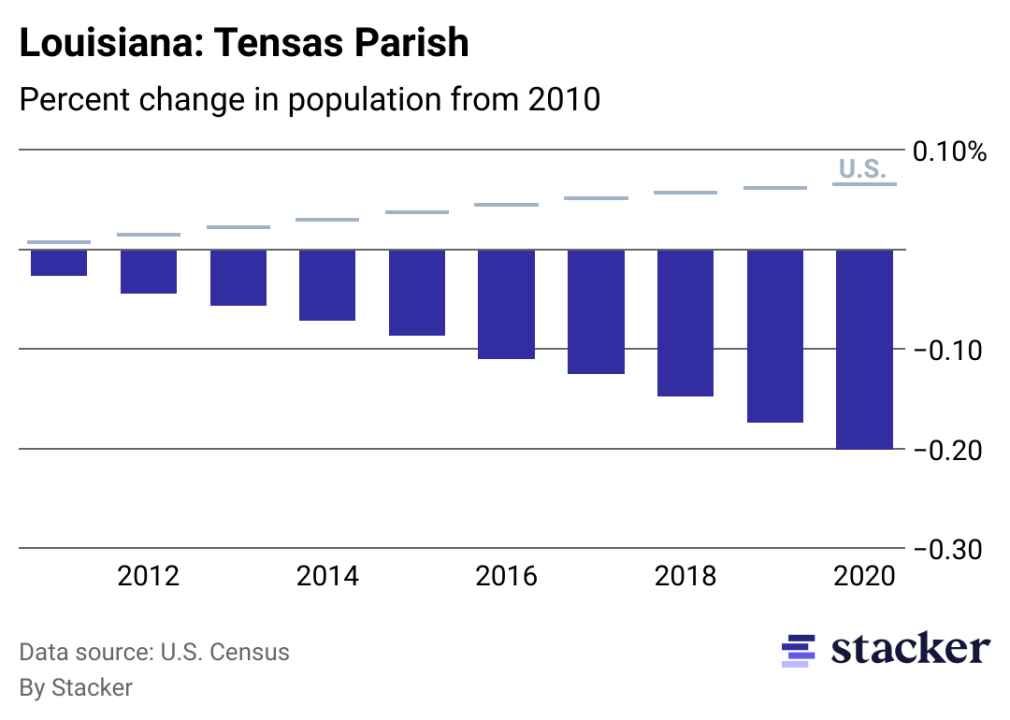
Louisiana: Tensas Parish
Chart showing 20.10% population decrease from 2010 to 2020 for Tensas Parish, Louisiana, compared to overall population increase for the U.S.
Stacker
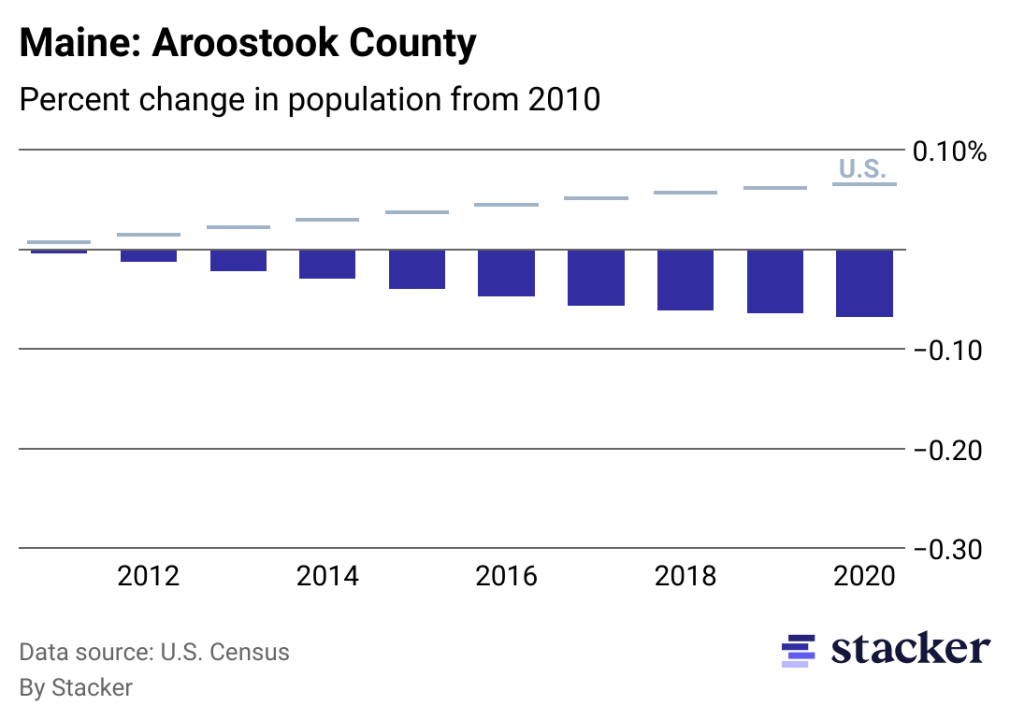
Maine: Aroostook County
Chart showing 6.83% population decrease from 2010 to 2020 for Aroostook County, Maine, compared to overall population increase for the U.S.
Stacker
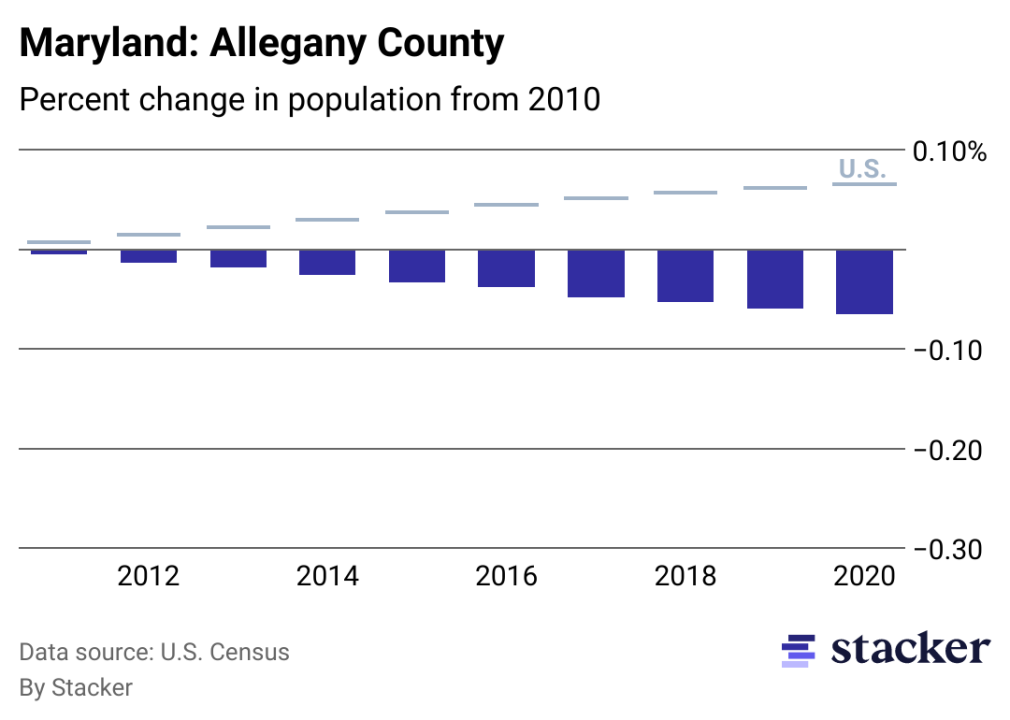
Maryland: Allegany County
Chart showing 6.55% population decrease from 2010 to 2020 for Allegany County, Maryland, compared to overall population increase for the U.S.
Stacker
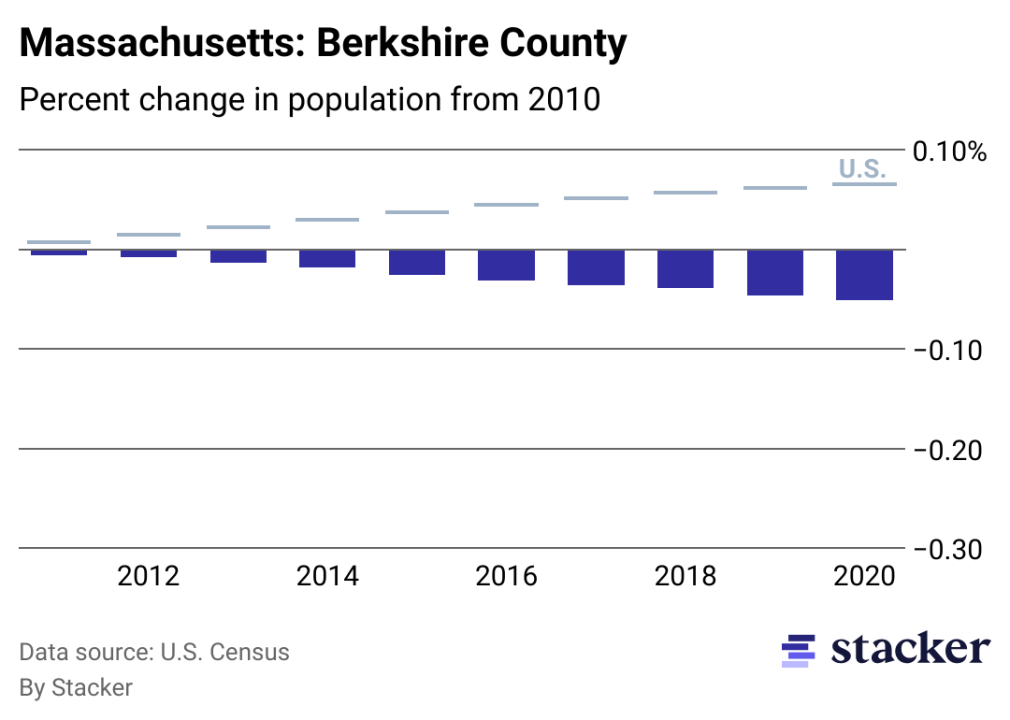
Massachusetts: Berkshire County
Chart showing 5.14% population decrease from 2010 to 2020 for Berkshire County, Massachusetts, compared to overall population increase for the U.S.
Stacker
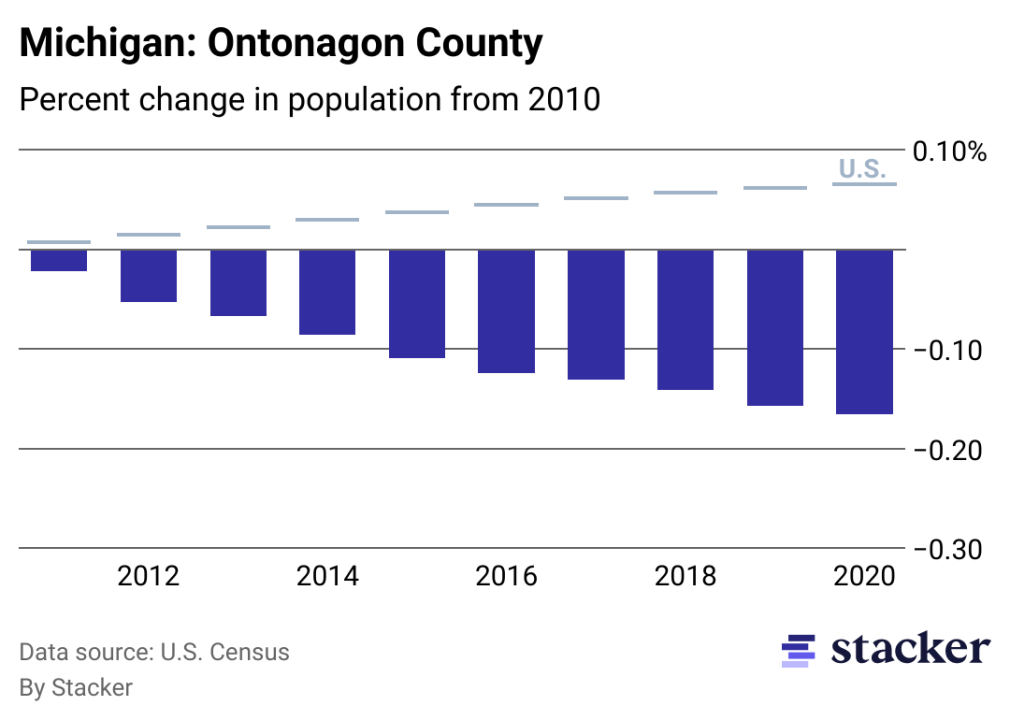
Michigan: Ontonagon County
Chart showing 16.53% population decrease from 2010 to 2020 for Ontonagon County, Michigan, compared to overall population increase for the U.S.
Stacker
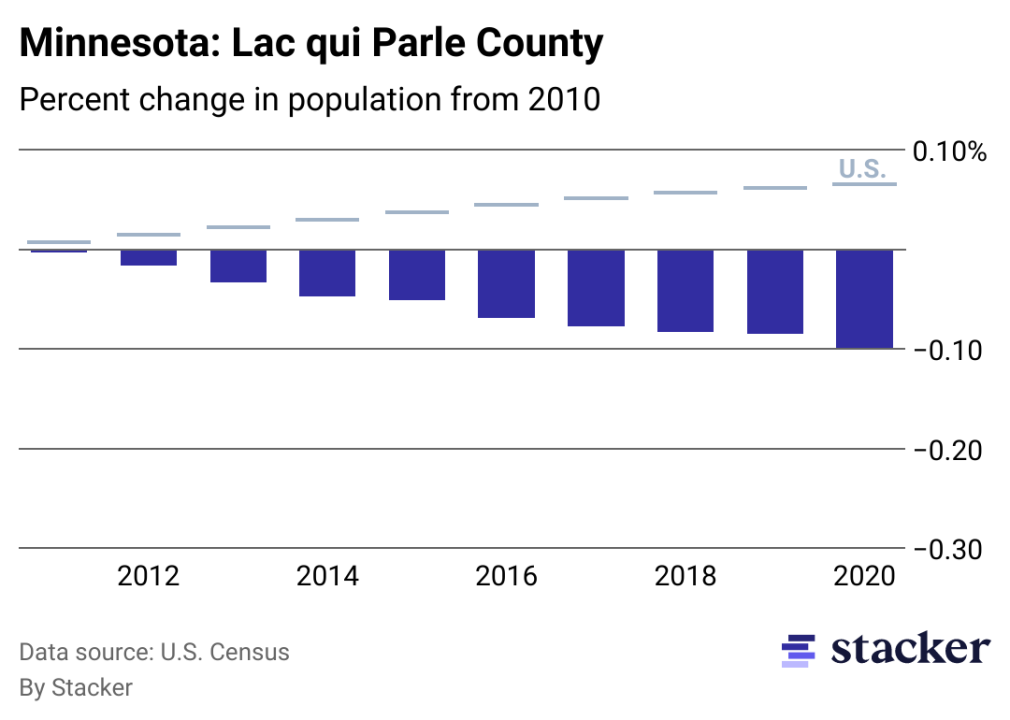
Minnesota: Lac qui Parle County
Chart showing 9.91% population decrease from 2010 to 2020 for Lac qui Parle County, Minnesota, compared to overall population increase for the U.S.
Stacker
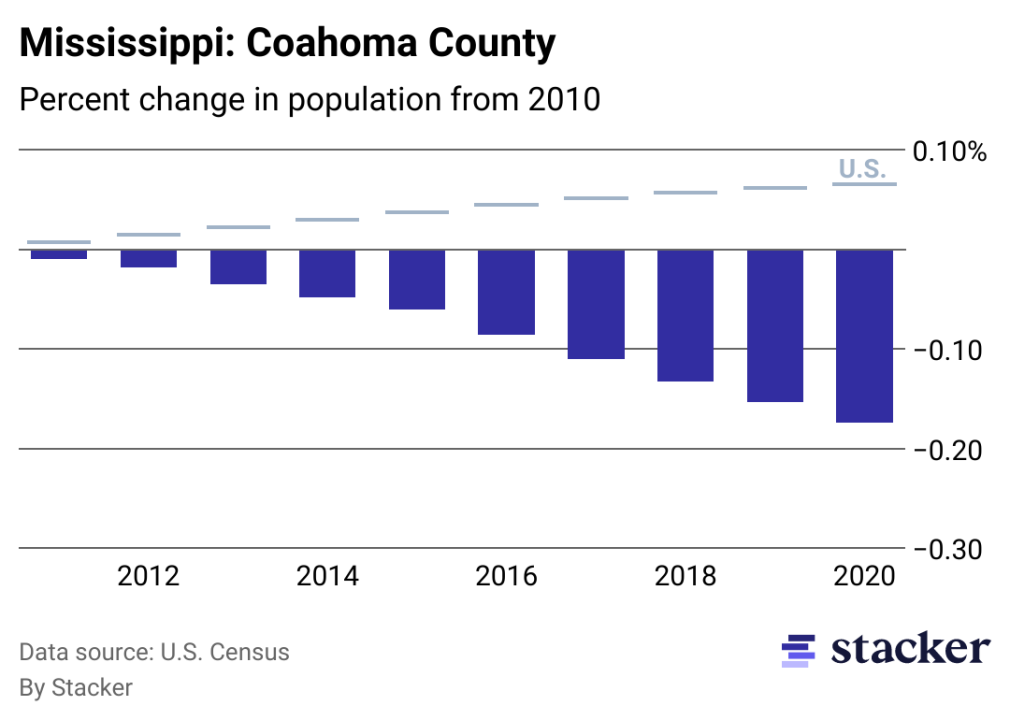
Mississippi: Coahoma County
Chart showing 17.41% population decrease from 2010 to 2020 for Coahoma County, Mississippi, compared to overall population increase for the U.S.
Stacker
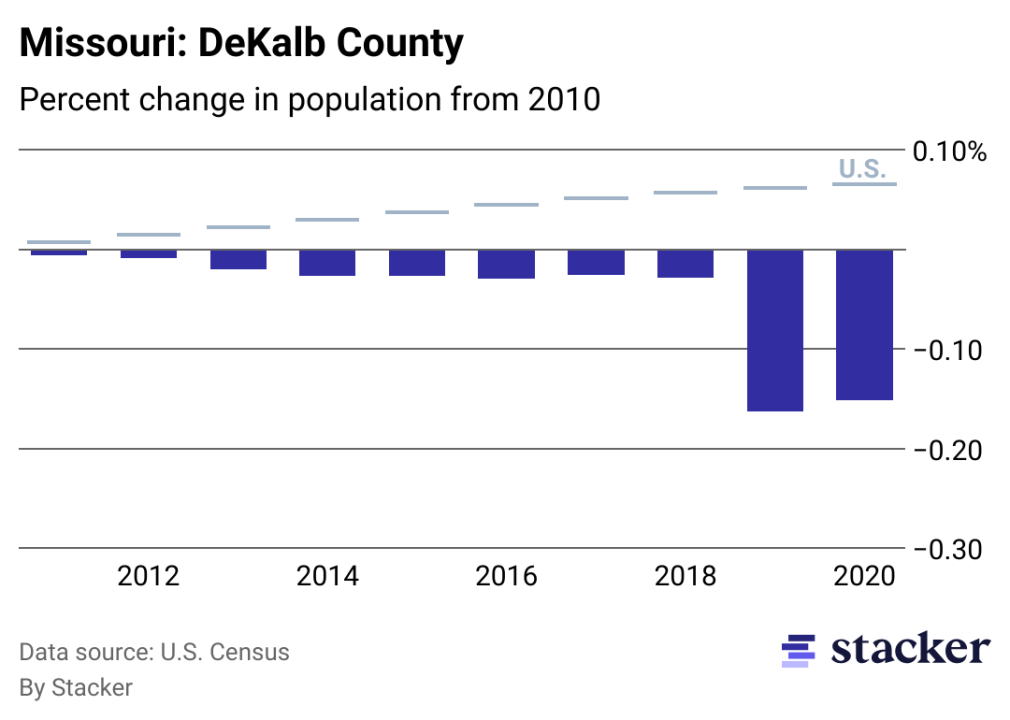
Missouri: DeKalb County
Chart showing 15.16% population decrease from 2010 to 2020 for DeKalb County, Missouri, compared to overall population increase for the U.S.
Stacker
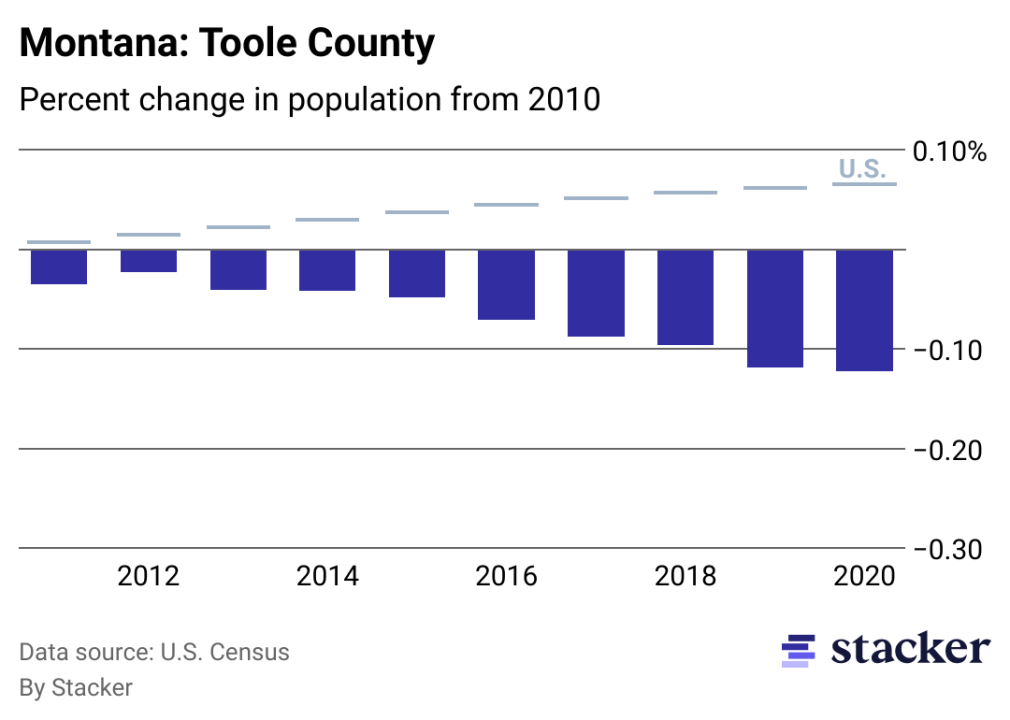
Montana: Toole County
Chart showing 12.30% population decrease from 2010 to 2020 for Toole County, Montana, compared to overall population increase for the U.S.
Stacker
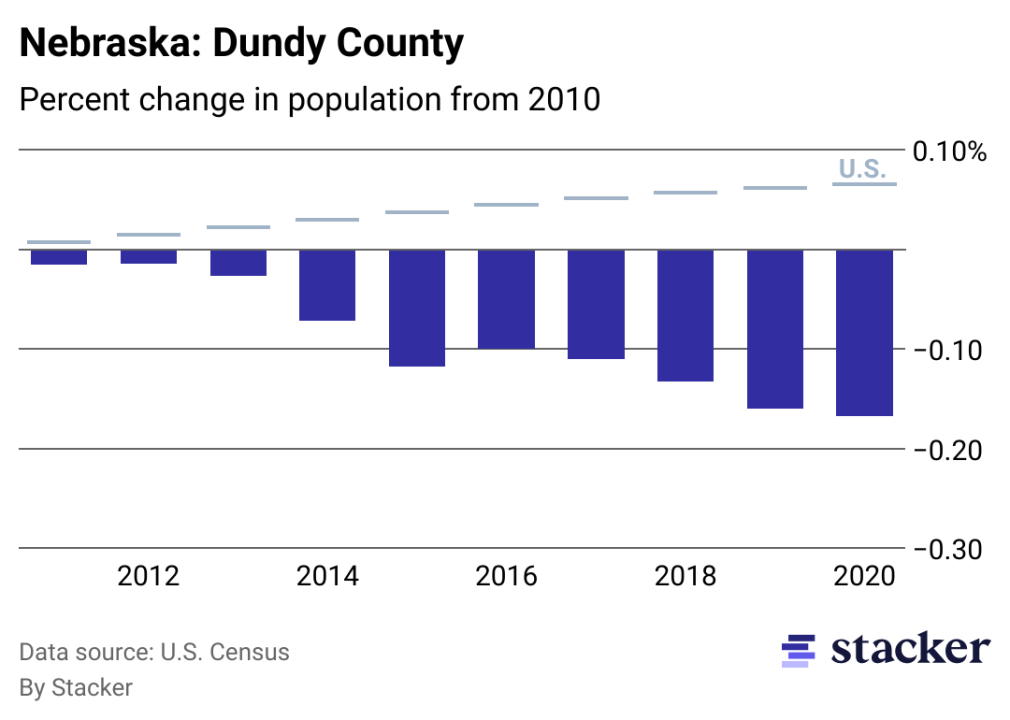
Nebraska: Dundy County
Stacker
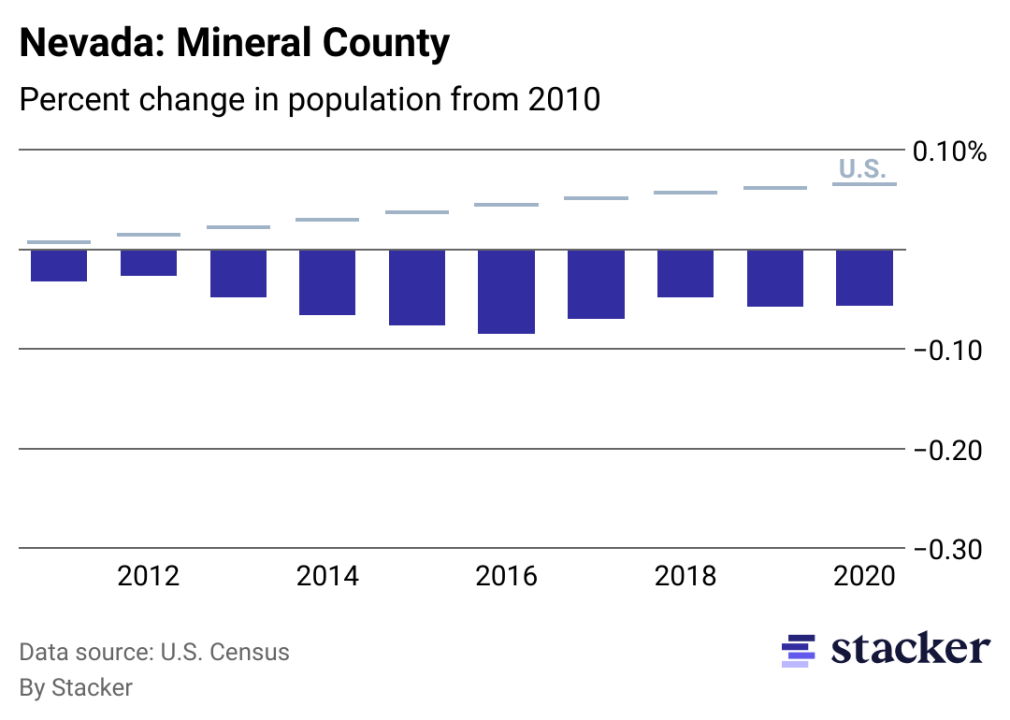
Nevada: Mineral County
Chart showing 5.70% population decrease from 2010 to 2020 for Mineral County, Nevada, compared to overall population increase for the U.S.
Stacker
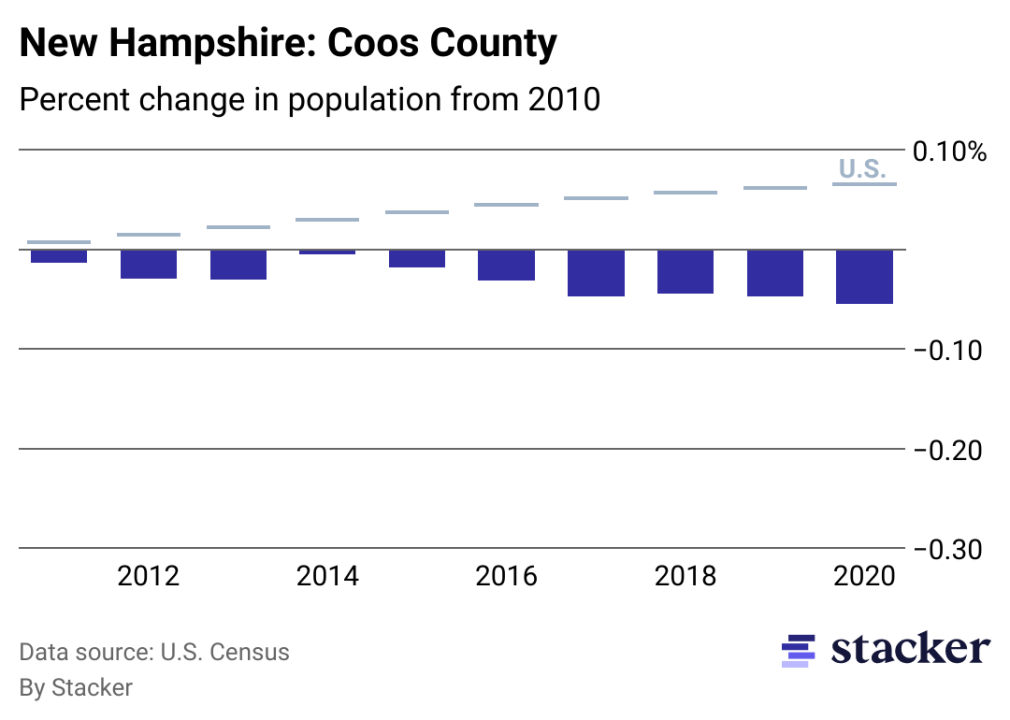
New Hampshire: Coos County
Chart showing 5.45% population decrease from 2010 to 2020 for Coos County, New Hampshire, compared to overall population increase for the U.S.
Stacker
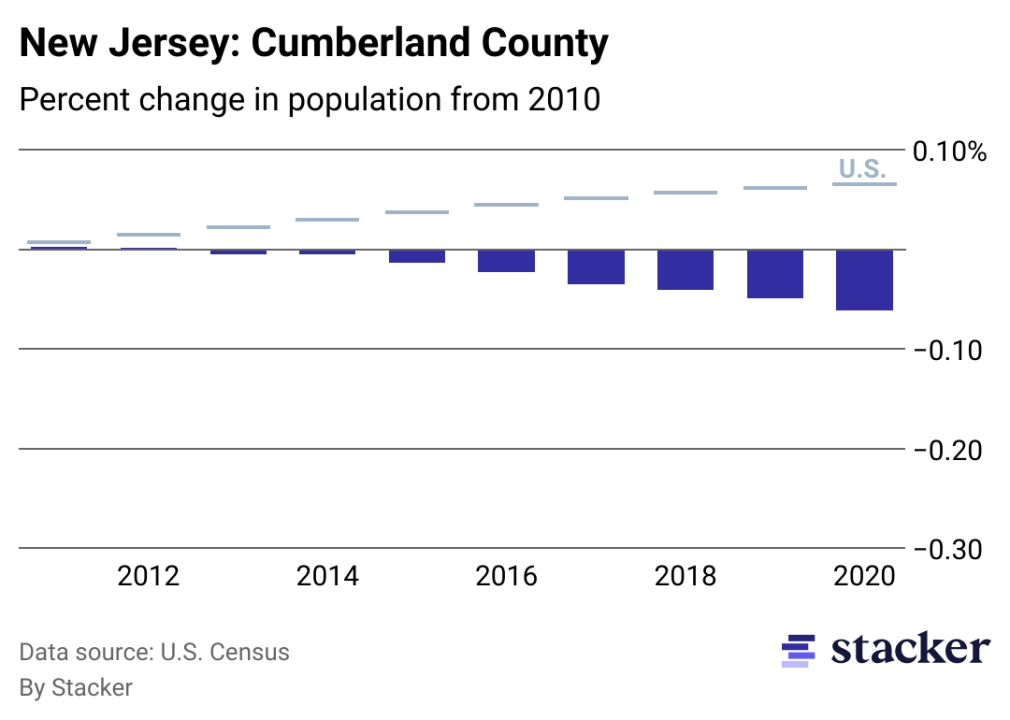
New Jersey: Cumberland County
Chart showing 6.17% population decrease from 2010 to 2020 for Cumberland County, New Jersey, compared to overall population increase for the U.S.
Stacker
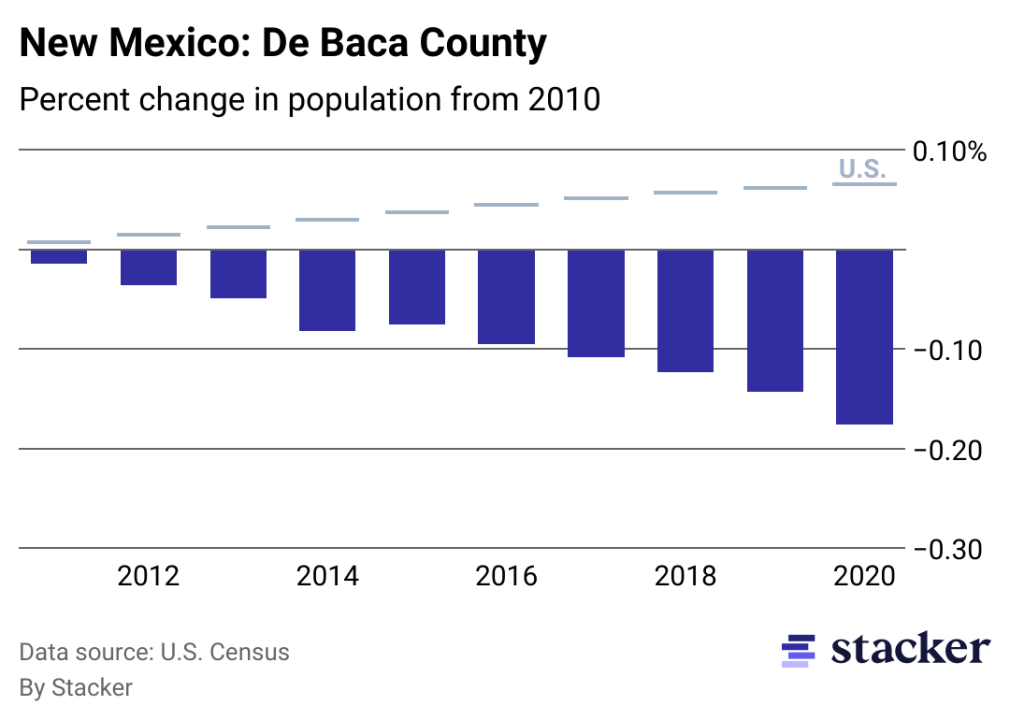
New Mexico: De Baca County
Chart showing 17.63% population decrease from 2010 to 2020 for De Baca County, New Mexico, compared to overall population increase for the U.S.

Stacker
New York: Hamilton County
Chart showing 10.45% population decrease from 2010 to 2020 for Hamilton County, New York, compared to overall population increase for the U.S.

Stacker
North Carolina: Hyde County
Chart showing 16.67% population decrease from 2010 to 2020 for Hyde County, North Carolina, compared to overall population increase for the U.S.
Stacker
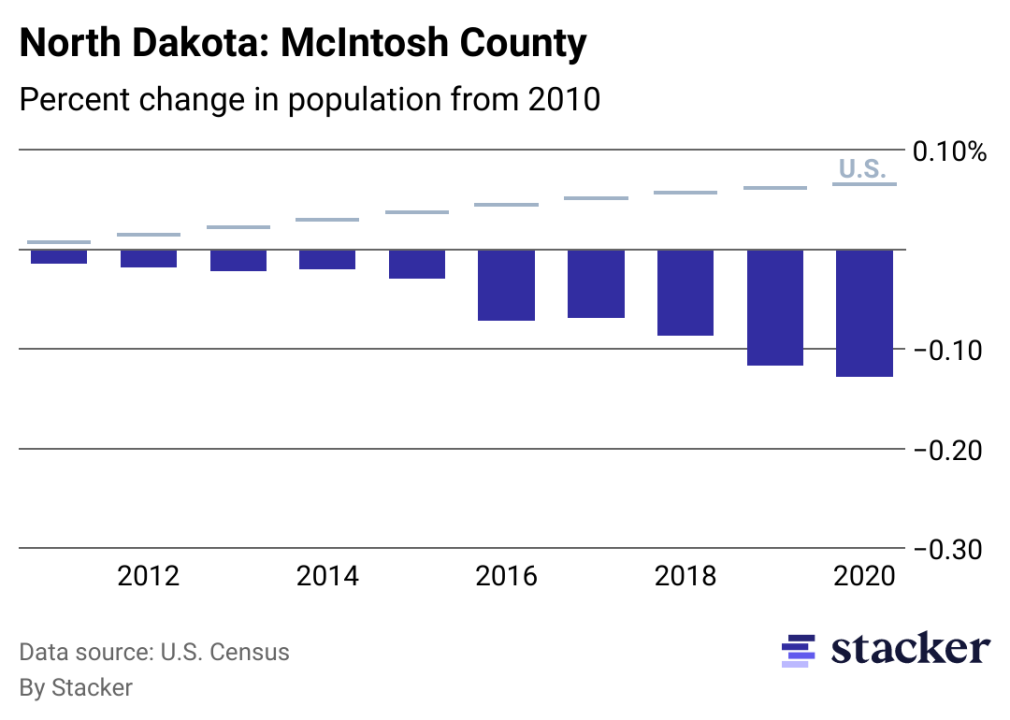
North Dakota: McIntosh County
Chart showing 12.86% population decrease from 2010 to 2020 for McIntosh County, North Dakota, compared to overall population increase for the U.S.
Stacker
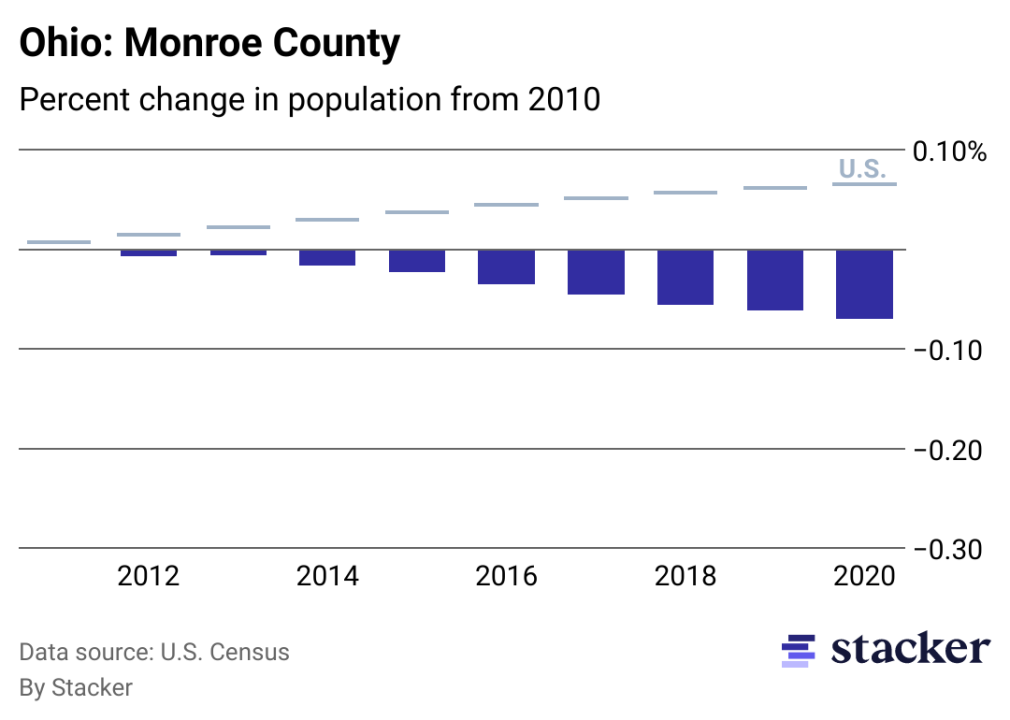
Ohio: Monroe County
Chart showing 7.00% population decrease from 2010 to 2020 for Monroe County, Ohio, compared to overall population increase for the U.S.
Stacker
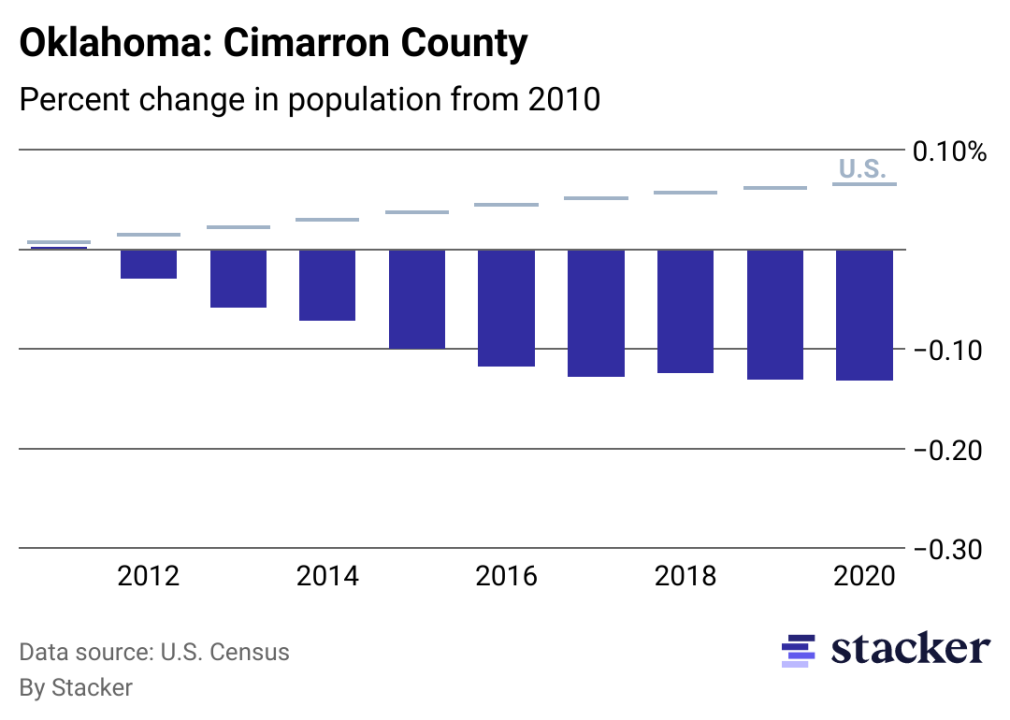
Oklahoma: Cimarron County
Chart showing 13.23% population decrease from 2010 to 2020 for Cimarron County, Oklahoma, compared to overall population increase for the U.S.
Stacker
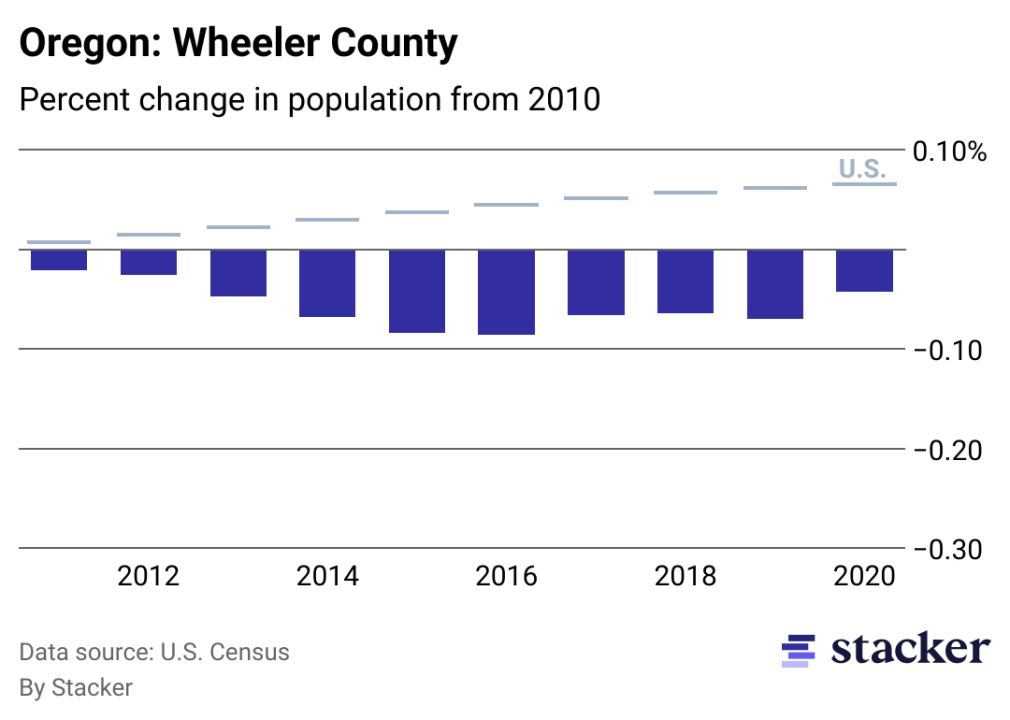
Oregon: Wheeler County
Chart showing 4.28% population decrease from 2010 to 2020 for Wheeler County, Oregon, compared to overall population increase for the U.S.
Stacker
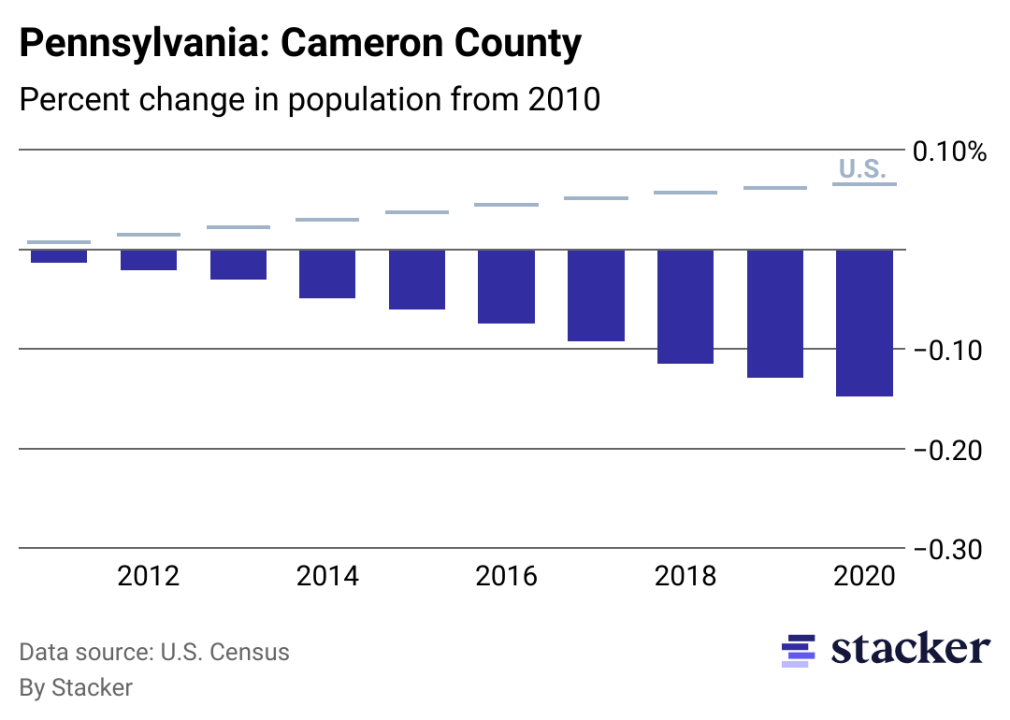
Pennsylvania: Cameron County
Chart showing 14.76% population decrease from 2010 to 2020 for Cameron County, Pennsylvania, compared to overall population increase for the U.S.
Stacker
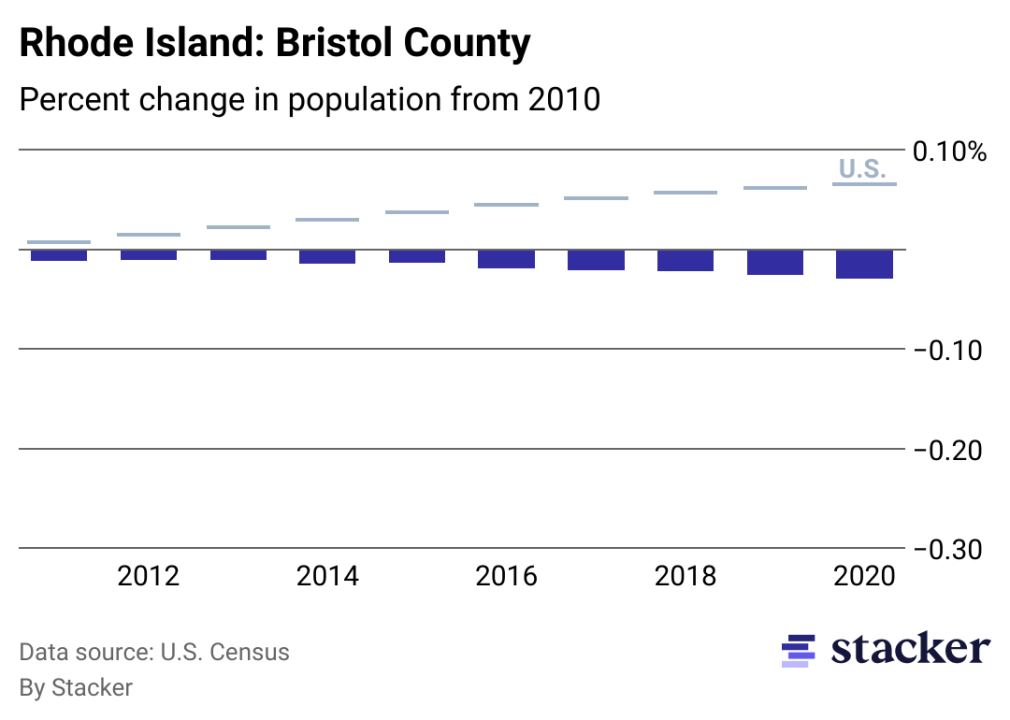
Rhode Island: Bristol County
Chart showing 2.94% population decrease from 2010 to 2020 for Bristol County, Rhode Island, compared to overall population increase for the U.S.
Stacker
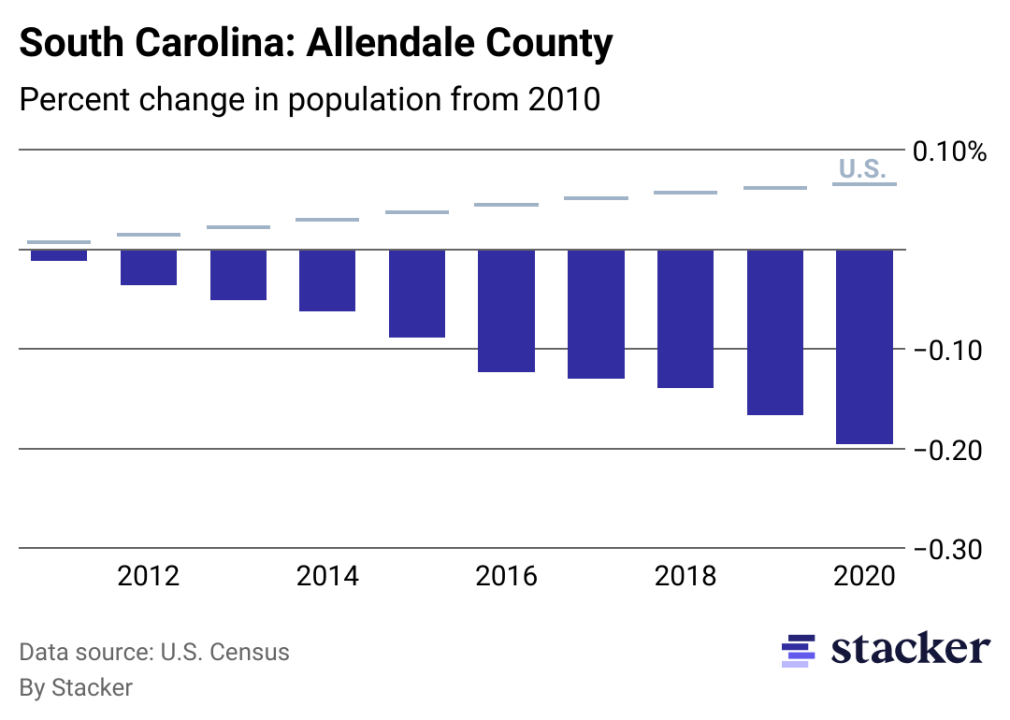
South Carolina: Allendale County
Chart showing 19.54% population decrease from 2010 to 2020 for Allendale County, South Carolina, compared to overall population increase for the U.S.
Stacker
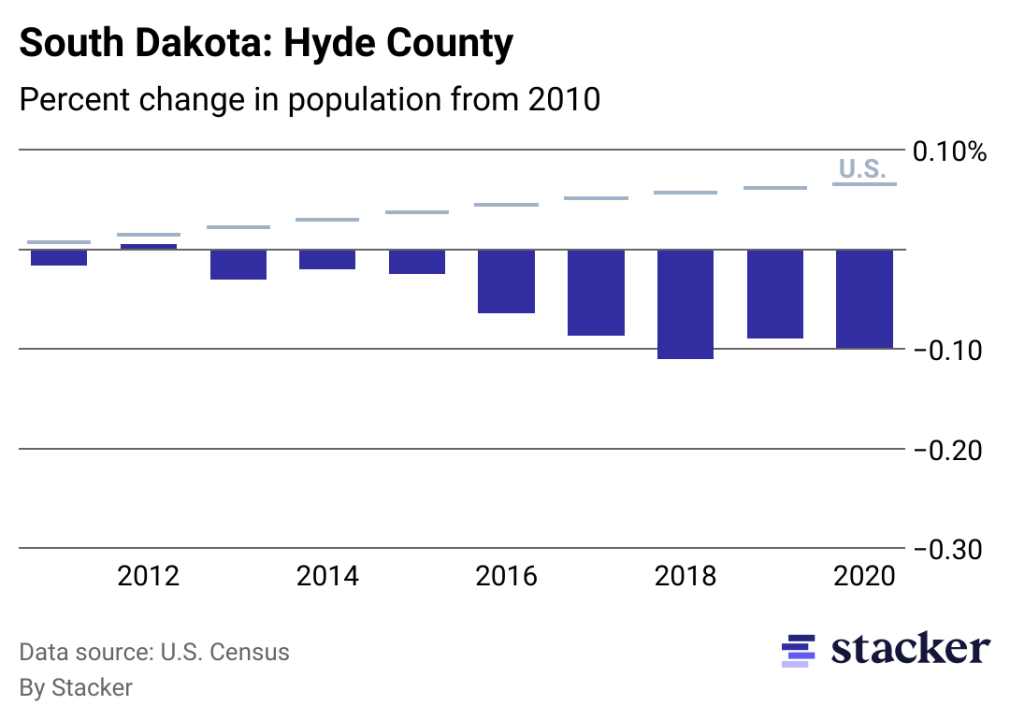
South Dakota: Hyde County
Chart showing 9.92% population decrease from 2010 to 2020 for Hyde County, South Dakota, compared to overall population increase for the U.S.
Stacker
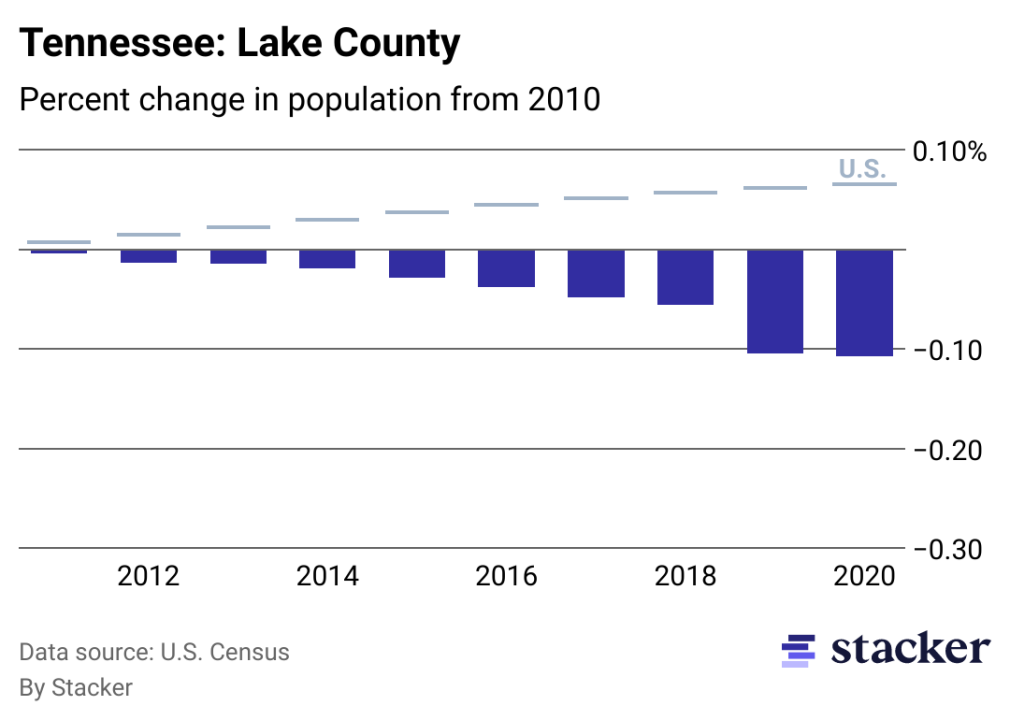
Tennessee: Lake County
Chart showing 10.72% population decrease from 2010 to 2020 for Lake County, Tennessee, compared to overall population increase for the U.S.
Stacker
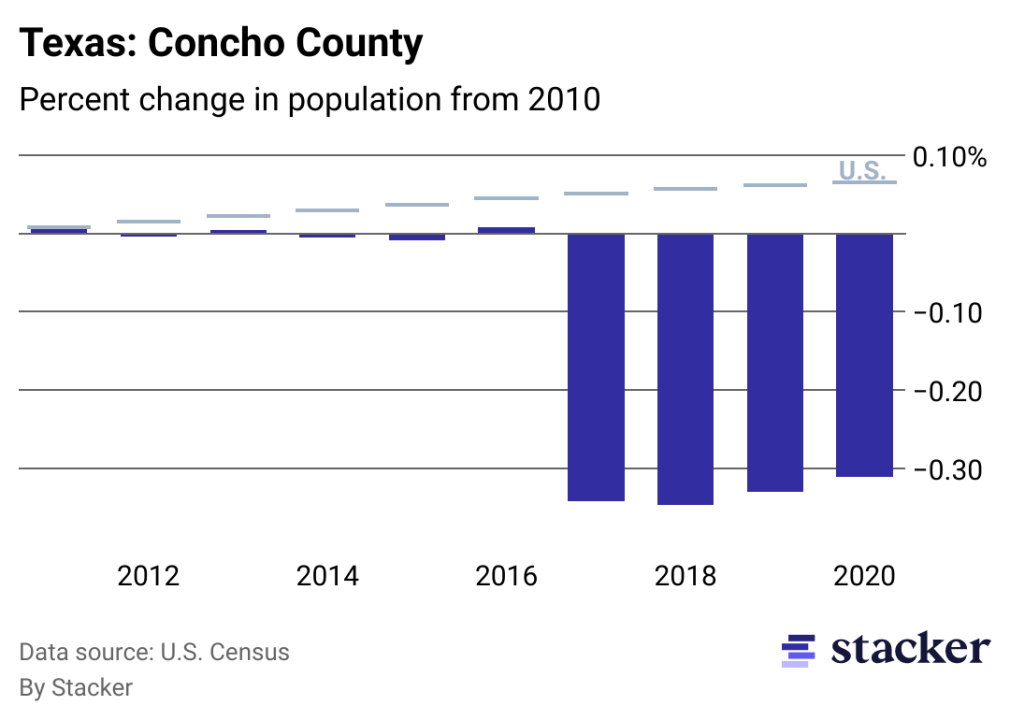
Texas: Concho County
Chart showing 31.07% population decrease from 2010 to 2020 for Concho County, Texas, compared to overall population increase for the U.S.
Stacker
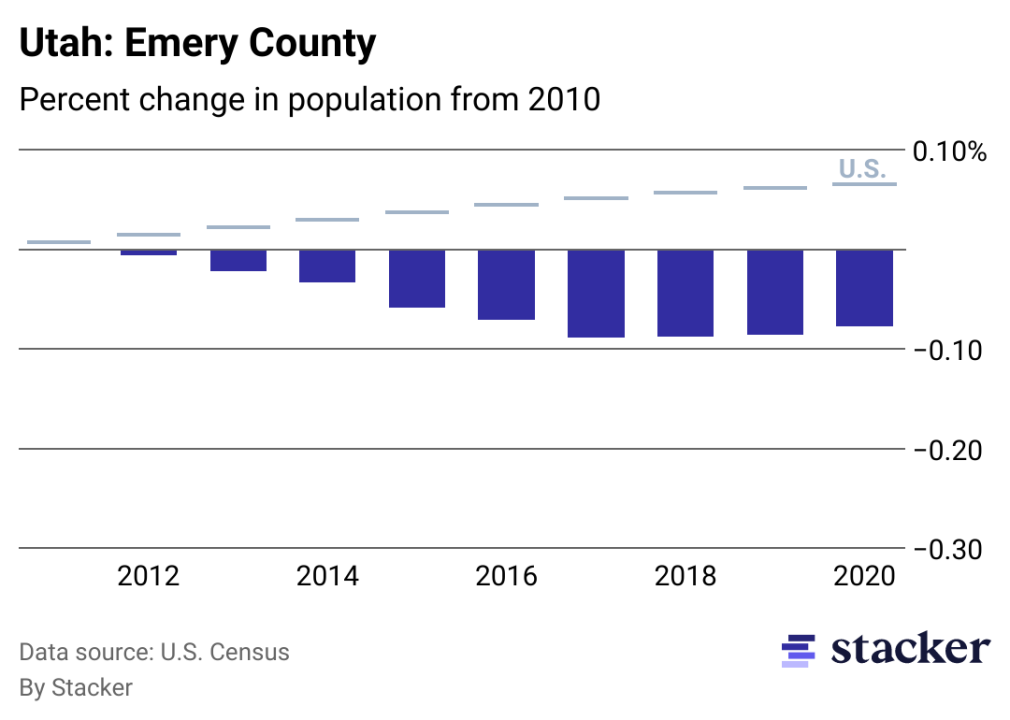
Utah: Emery County
Chart showing 7.79% population decrease from 2010 to 2020 for Emery County, Utah, compared to overall population increase for the U.S.
Stacker
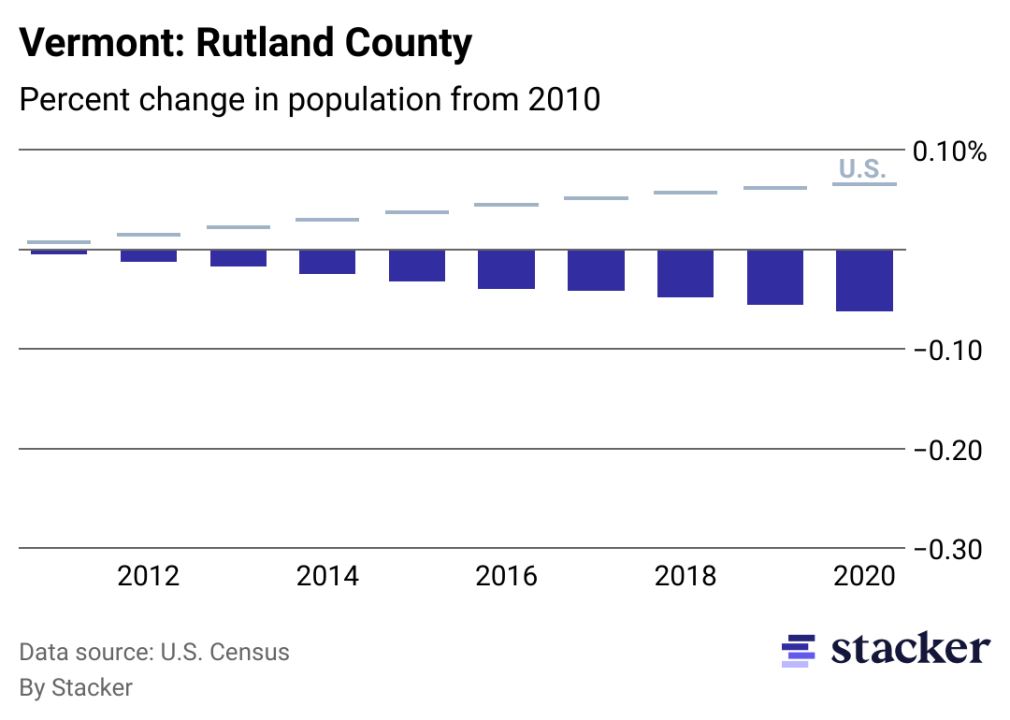
Vermont: Rutland County
Chart showing 6.20% population decrease from 2010 to 2020 for Rutland County, Vermont, compared to overall population increase for the U.S.
Stacker
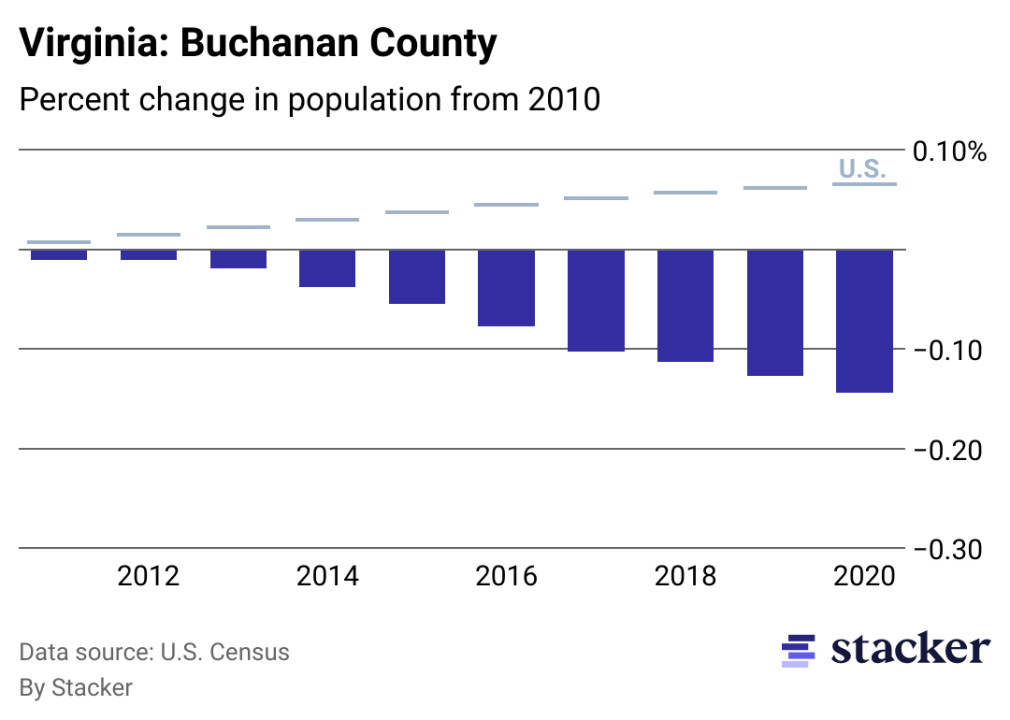
Virginia: Buchanan County
Chart showing 14.44% population decrease from 2010 to 2020 for Buchanan County, Virginia, compared to overall population increase for the U.S.
Stacker
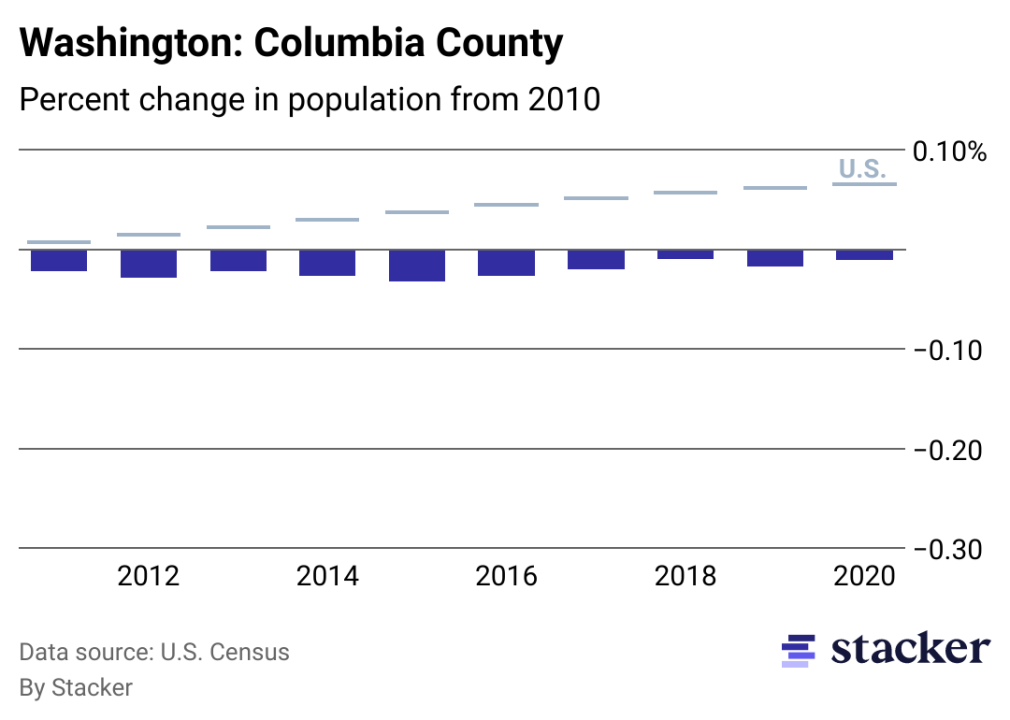
Washington: Columbia County
Chart showing 1.12% population decrease from 2010 to 2020 for Columbia County, Washington, compared to overall population increase for the U.S.
Stacker
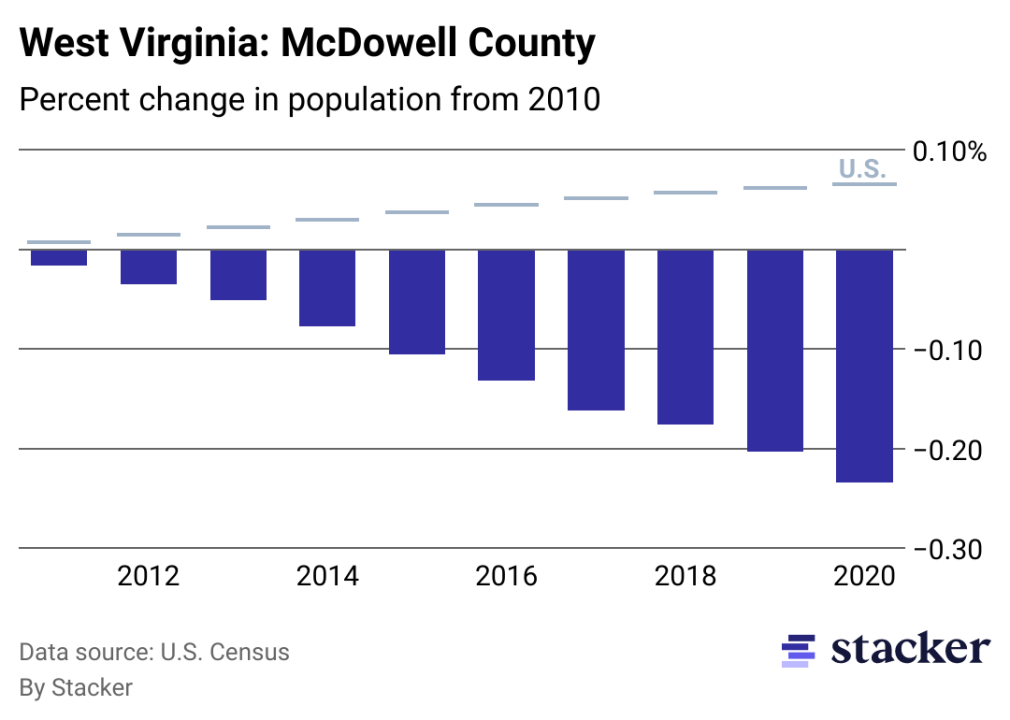
West Virginia: McDowell County
Chart showing 23.44% population decrease from 2010 to 2020 for McDowell County, West Virginia, compared to overall population increase for the U.S.
Stacker
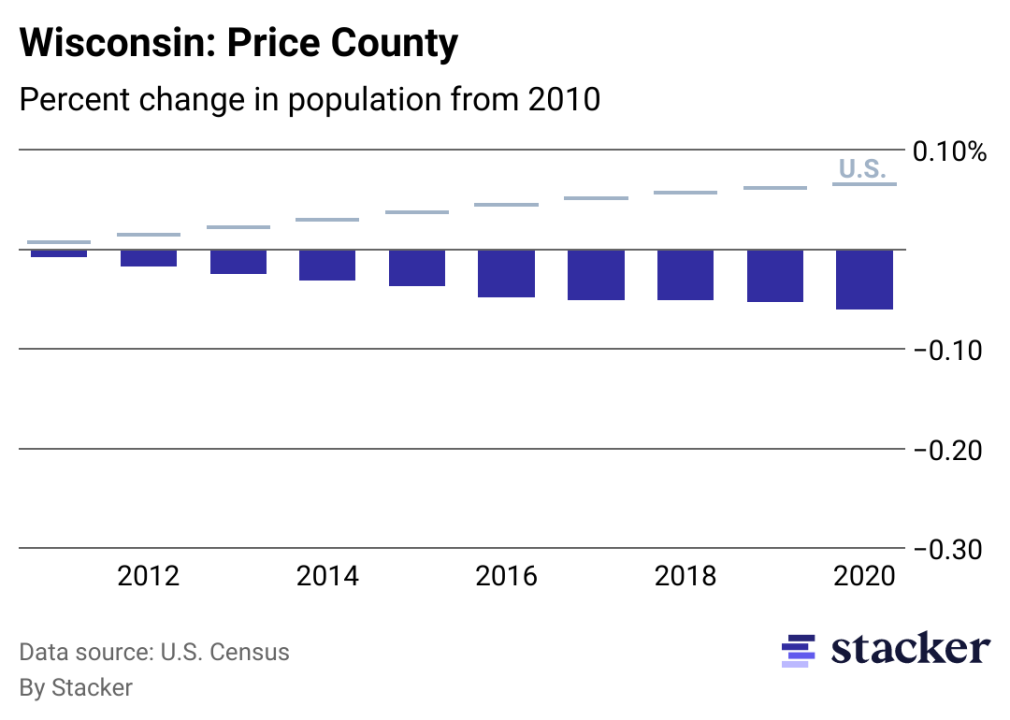
Wisconsin: Price County
Chart showing 6.04% population decrease from 2010 to 2020 for Price County, Wisconsin, compared to overall population increase for the U.S.
Stacker
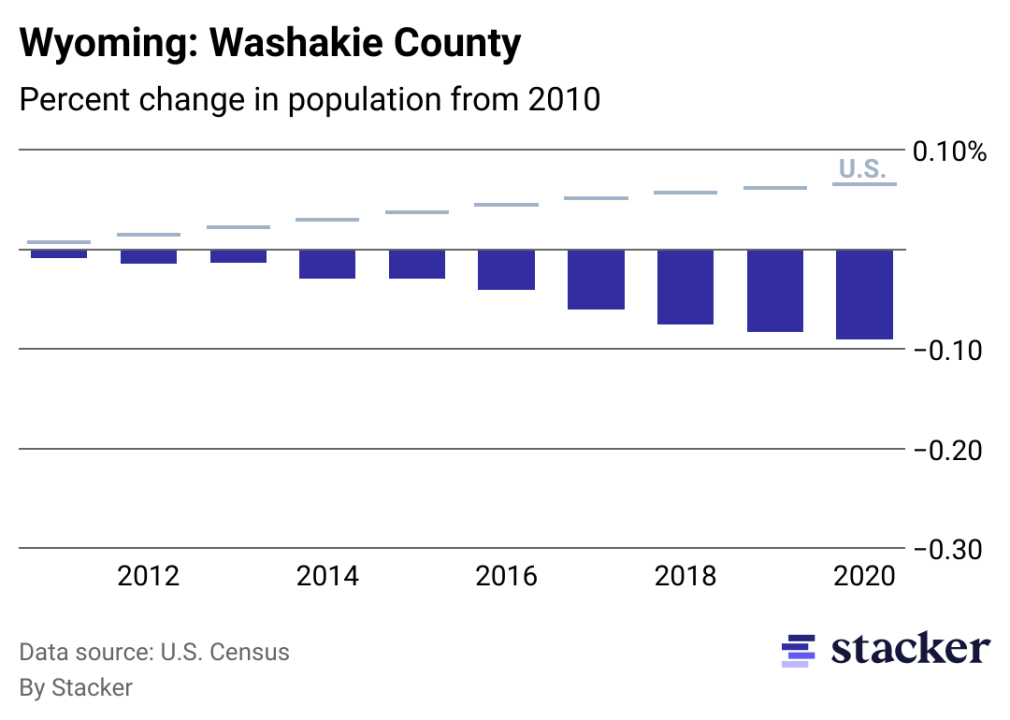
Wyoming: Washakie County
Chart showing 9.04% population decrease from 2010 to 2020 for Washakie County, Wyoming, compared to overall population increase for the U.S.