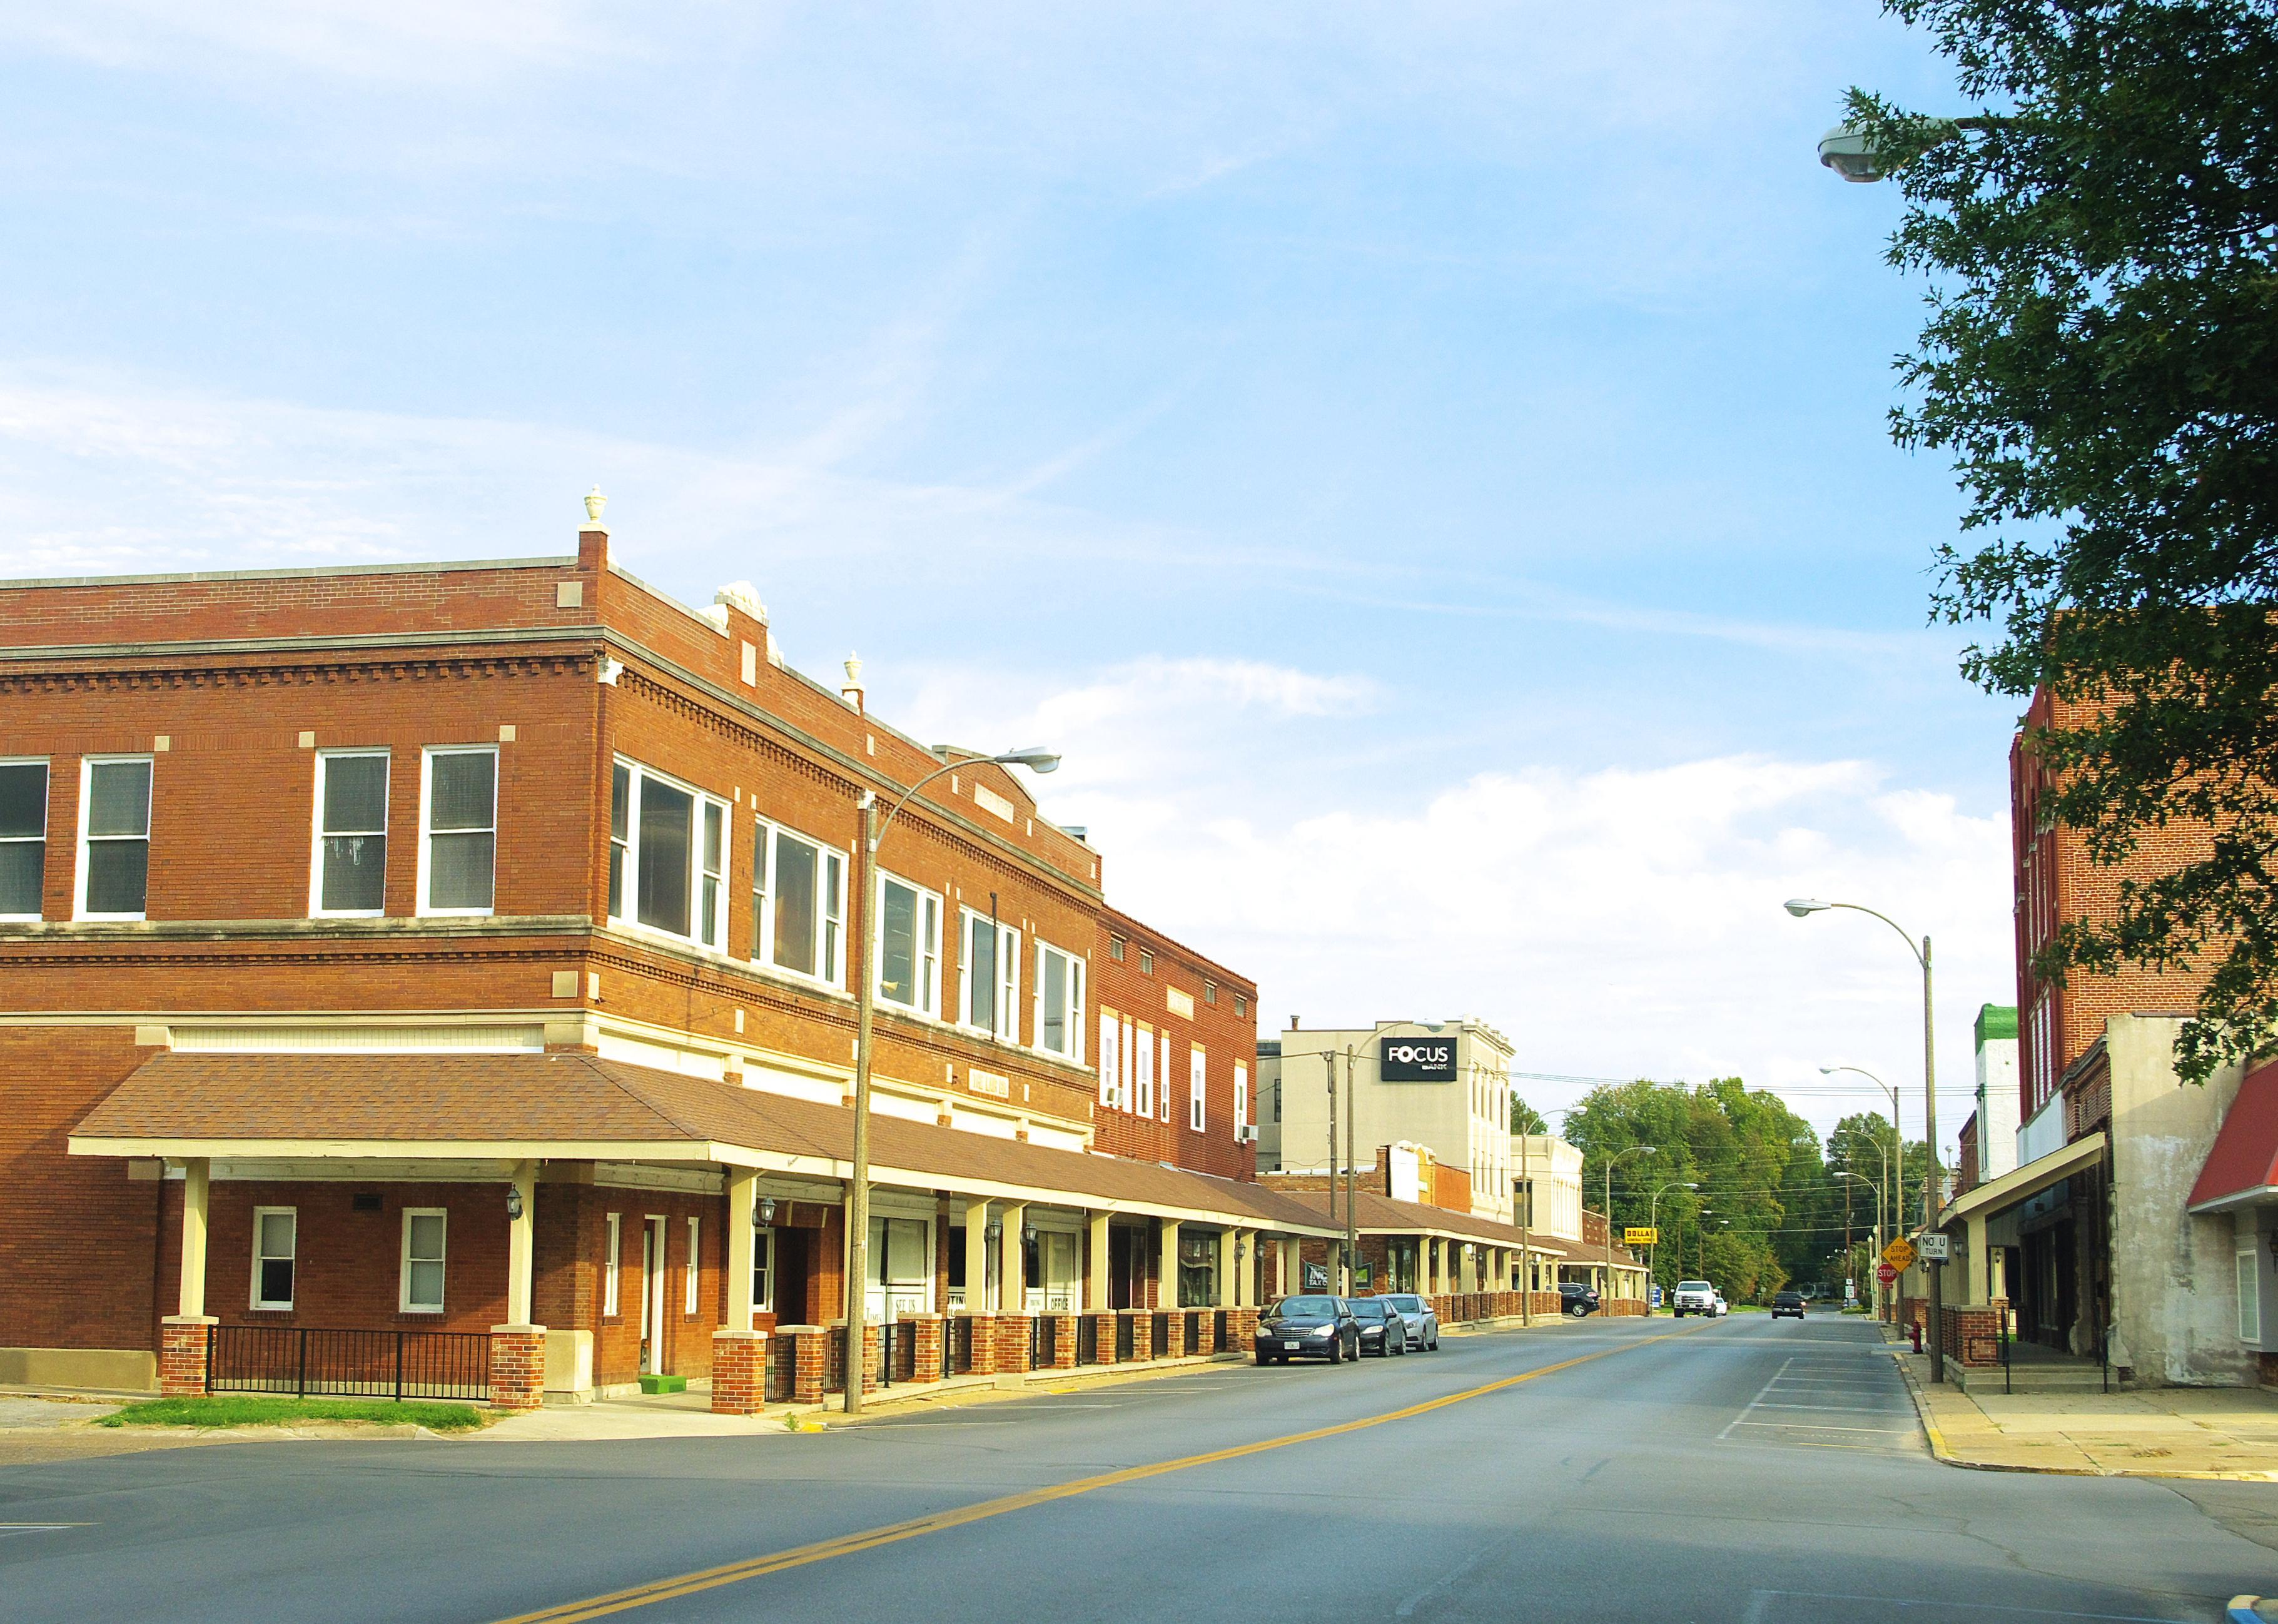
Counties with the most emergency shelters in Missouri

Americasroof // Wikimedia Commons
Counties with the most emergency shelters in Missouri
As climate change drives weather to greater extremes, and devastating hurricanes, wildfires, droughts, and blizzards preoccupy an increasing number of Americans, it is hard to avoid comparing the reality of everyday news coverage to the computer-generated images seen in disaster movies.
Over the last 50 years, natural disasters have become five times more common due to climate change, according to the World Meteorological Organization. They’ve also become more economically debilitating—the five most expensive climate disasters in American history have all taken place over the last two decades.
The increasing frequency and severity of natural disasters means that the need for emergency evacuation and shelter plans has never been greater. According to the Federal Emergency Management Association, understanding your climate risk, or proximity to probable natural disaster, is an important first step for making a plan. Tools like the Climate Mapping for Resilience and Adaptation allow you to assess your risk by location.
Knowing where nearby emergency shelters are located is another way to prepare for the worst. In the event of flooding, hurricane-level winds, or other disasters, emergency shelters offer a place to sleep, and also often provide food, water, and first aid services. Stacker examined the Department of Homeland Security’s National Shelter System Facilities database to identify the counties with the most emergency shelters in Missouri. Counties are ranked by emergency shelters per 100K people, with total capacity per 100K people serving as a tiebreaker.
![]()
Brian Stansberry // Wikimedia Commons
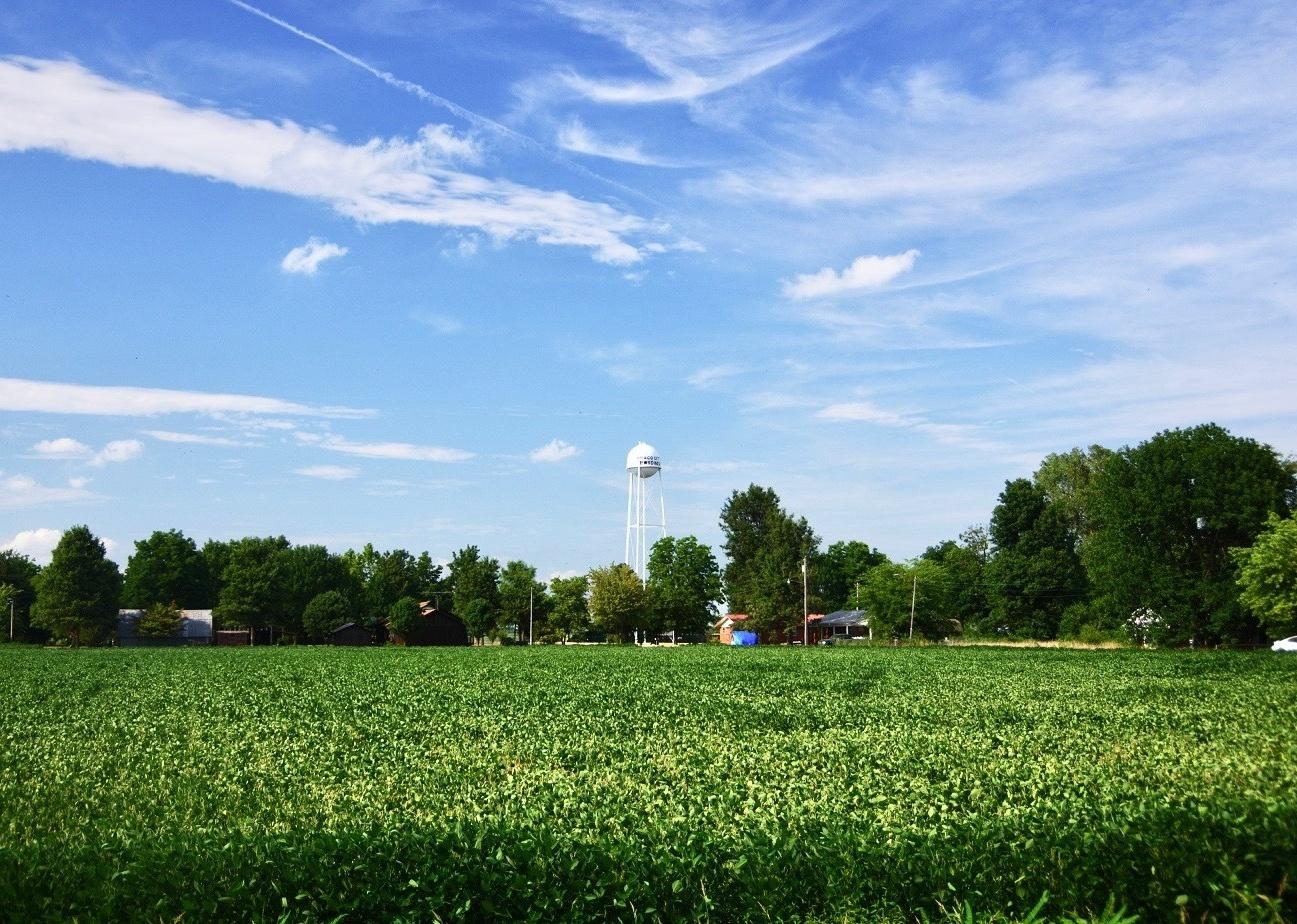
#50. Pemiscot County
– Emergency shelters per 100K people: 69.0 (11 shelters in database)
– Emergency shelter capacity per 100K: 14,680,168 people (2,341,340 total capacity)
– Shelters with generators: 0
– Shelters in 100-year floodplain: 0
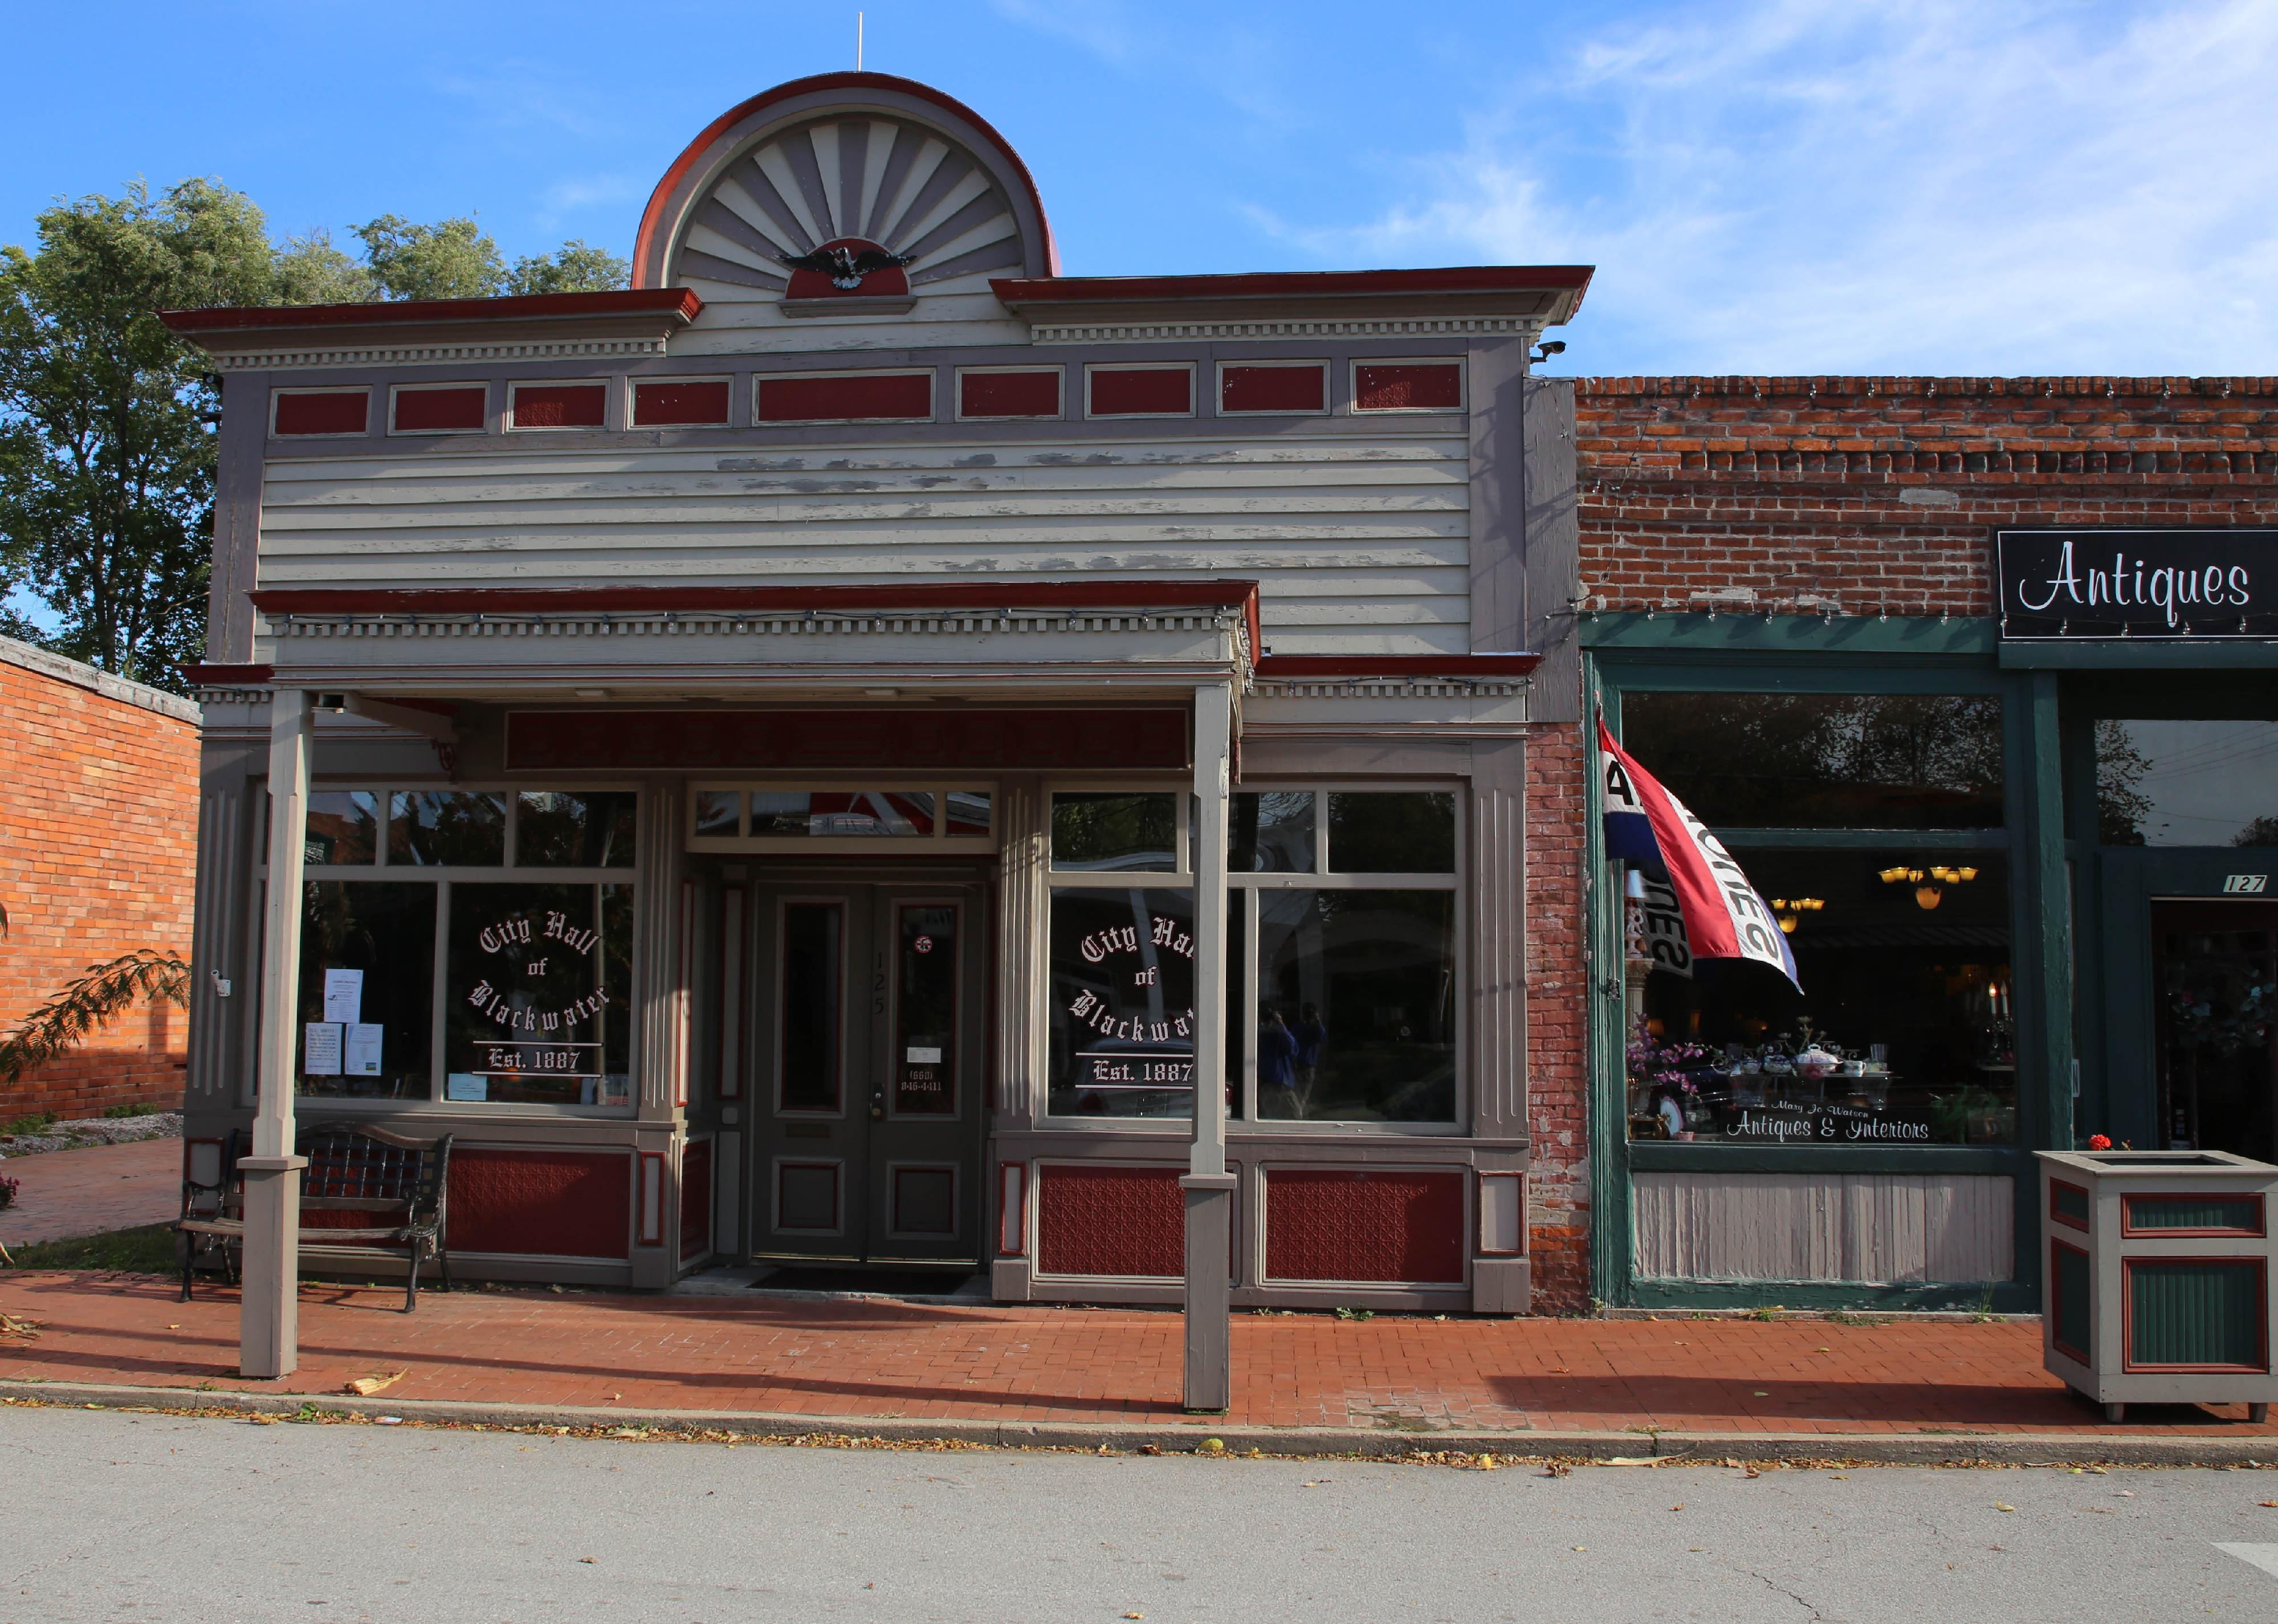
Kbh3rd // Wikimedia Commons
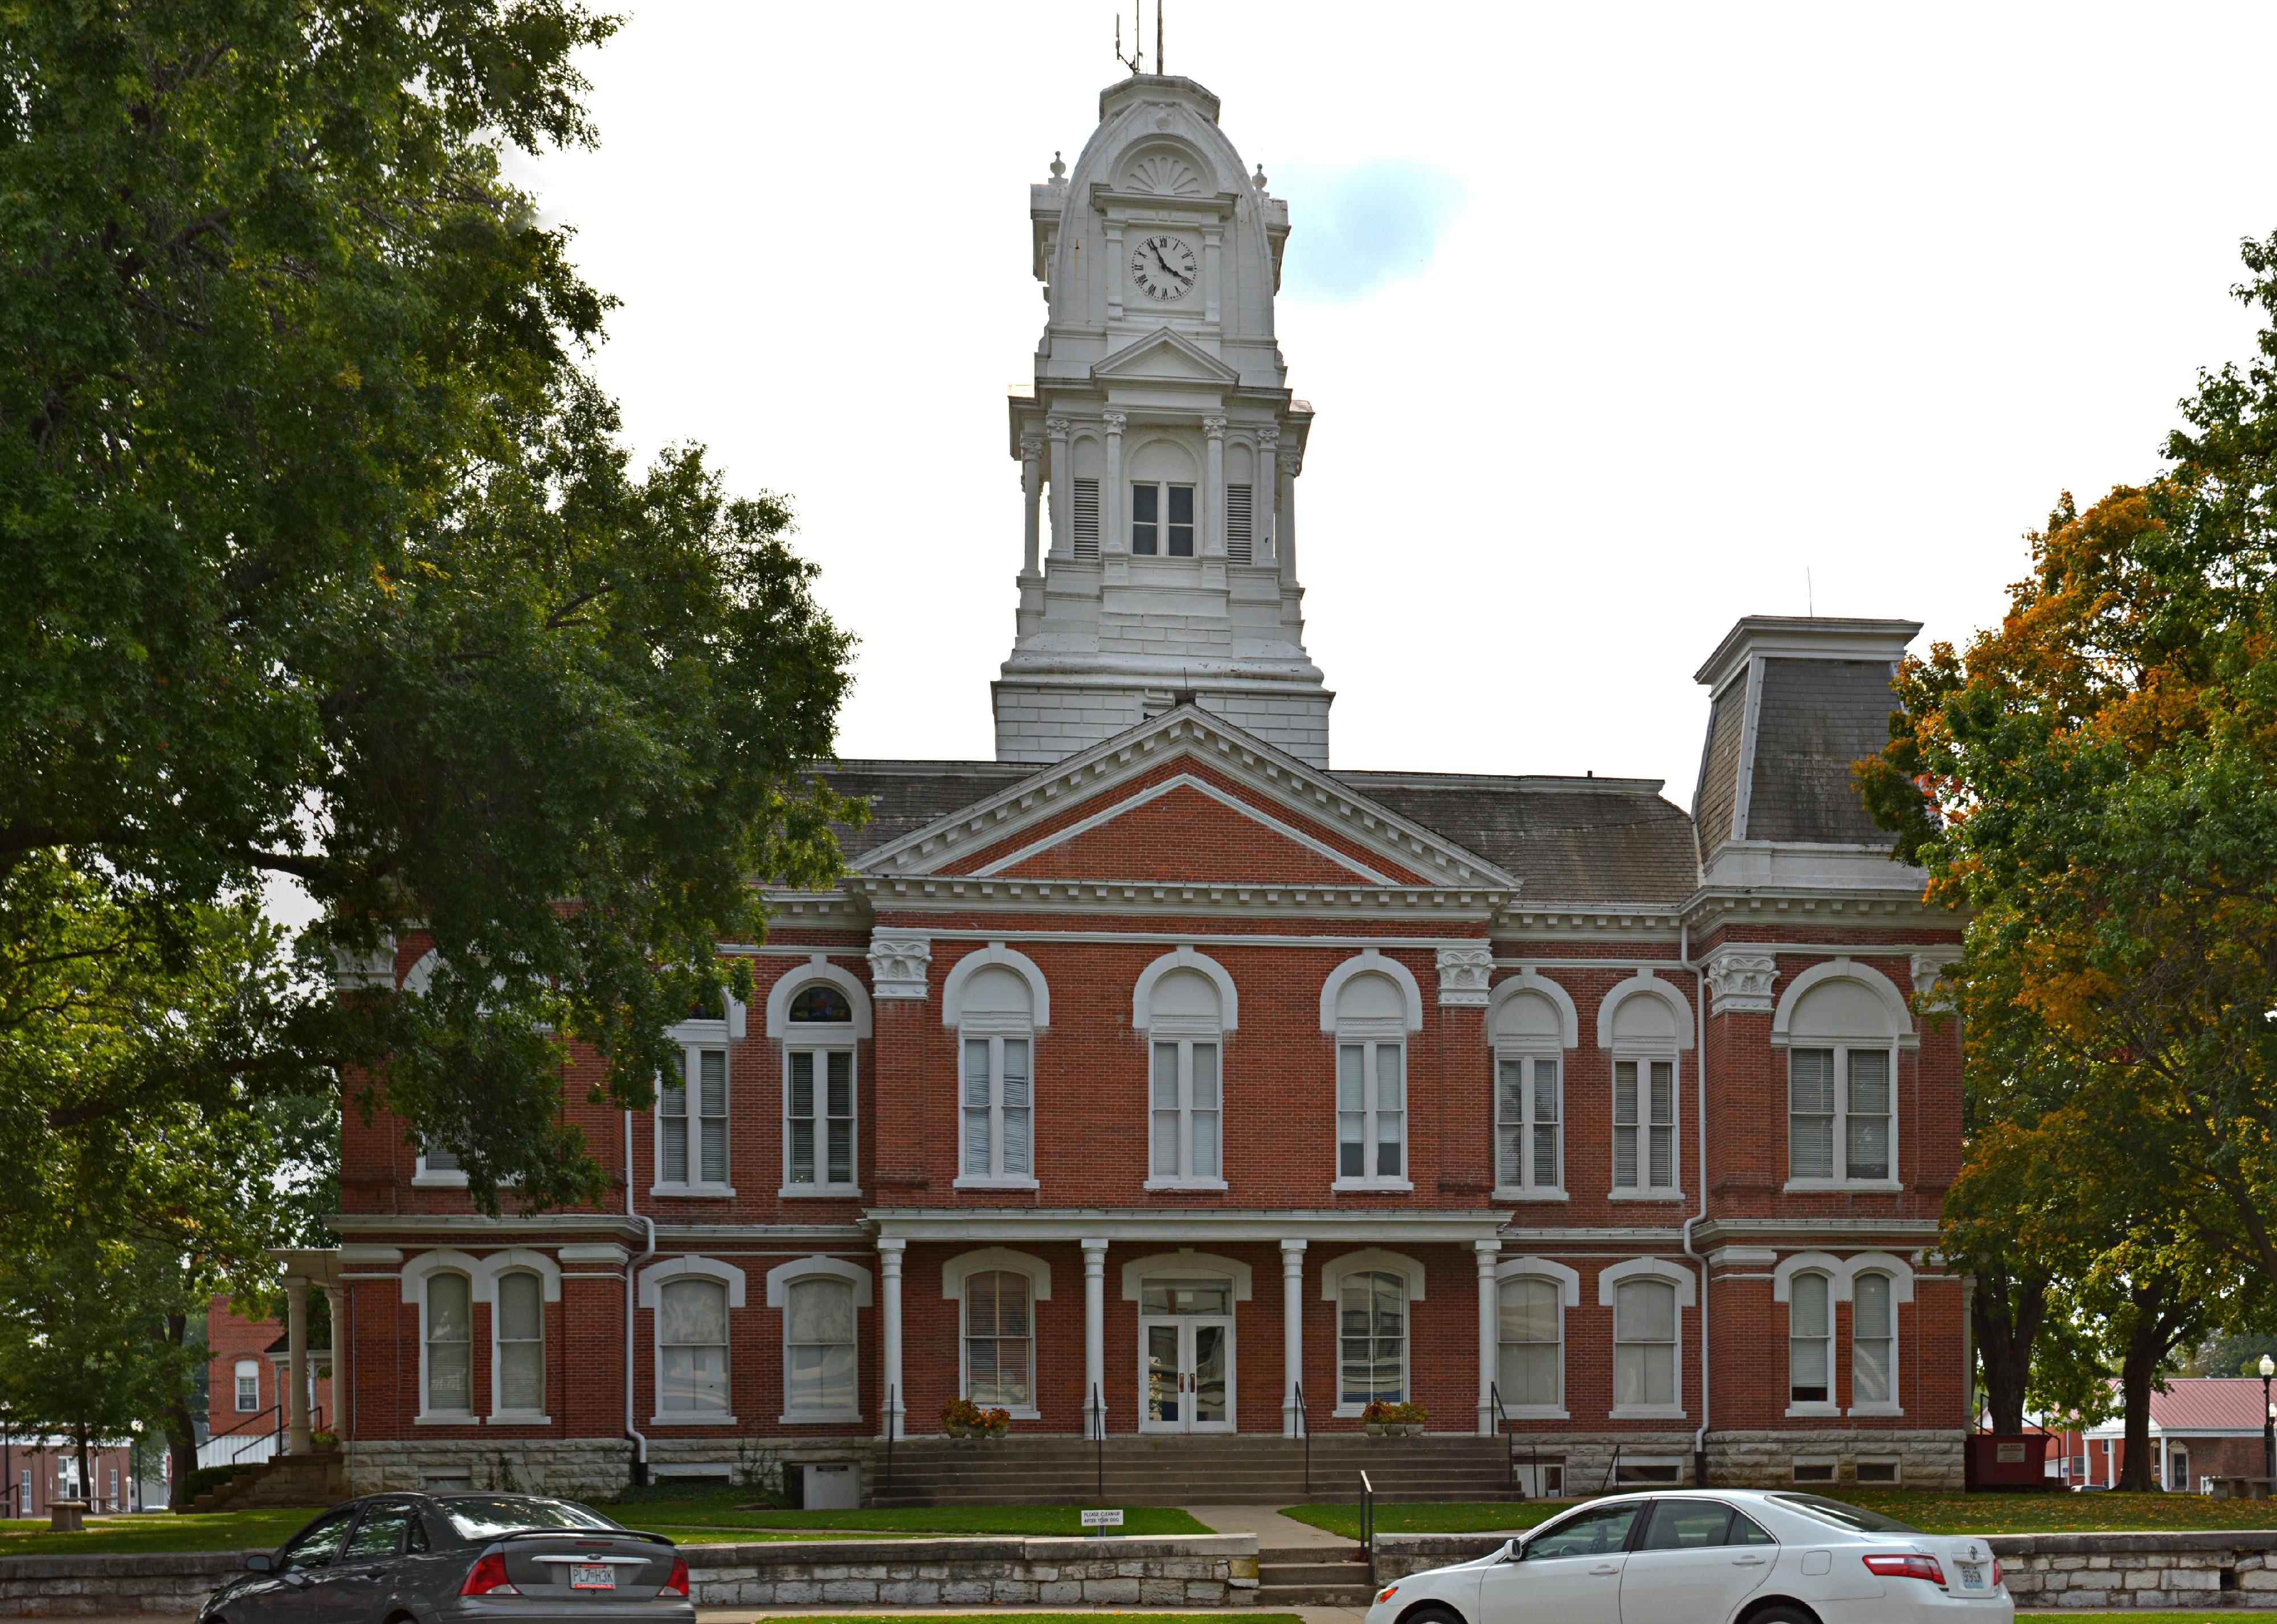
#49. Howard County
– Emergency shelters per 100K people: 69.0 (7 shelters in database)
– Emergency shelter capacity per 100K: 19,131,980 people (1,941,322 total capacity)
– Shelters with generators: 0
– Shelters in 100-year floodplain: 0

Kbh3rd // Wikimedia Commons
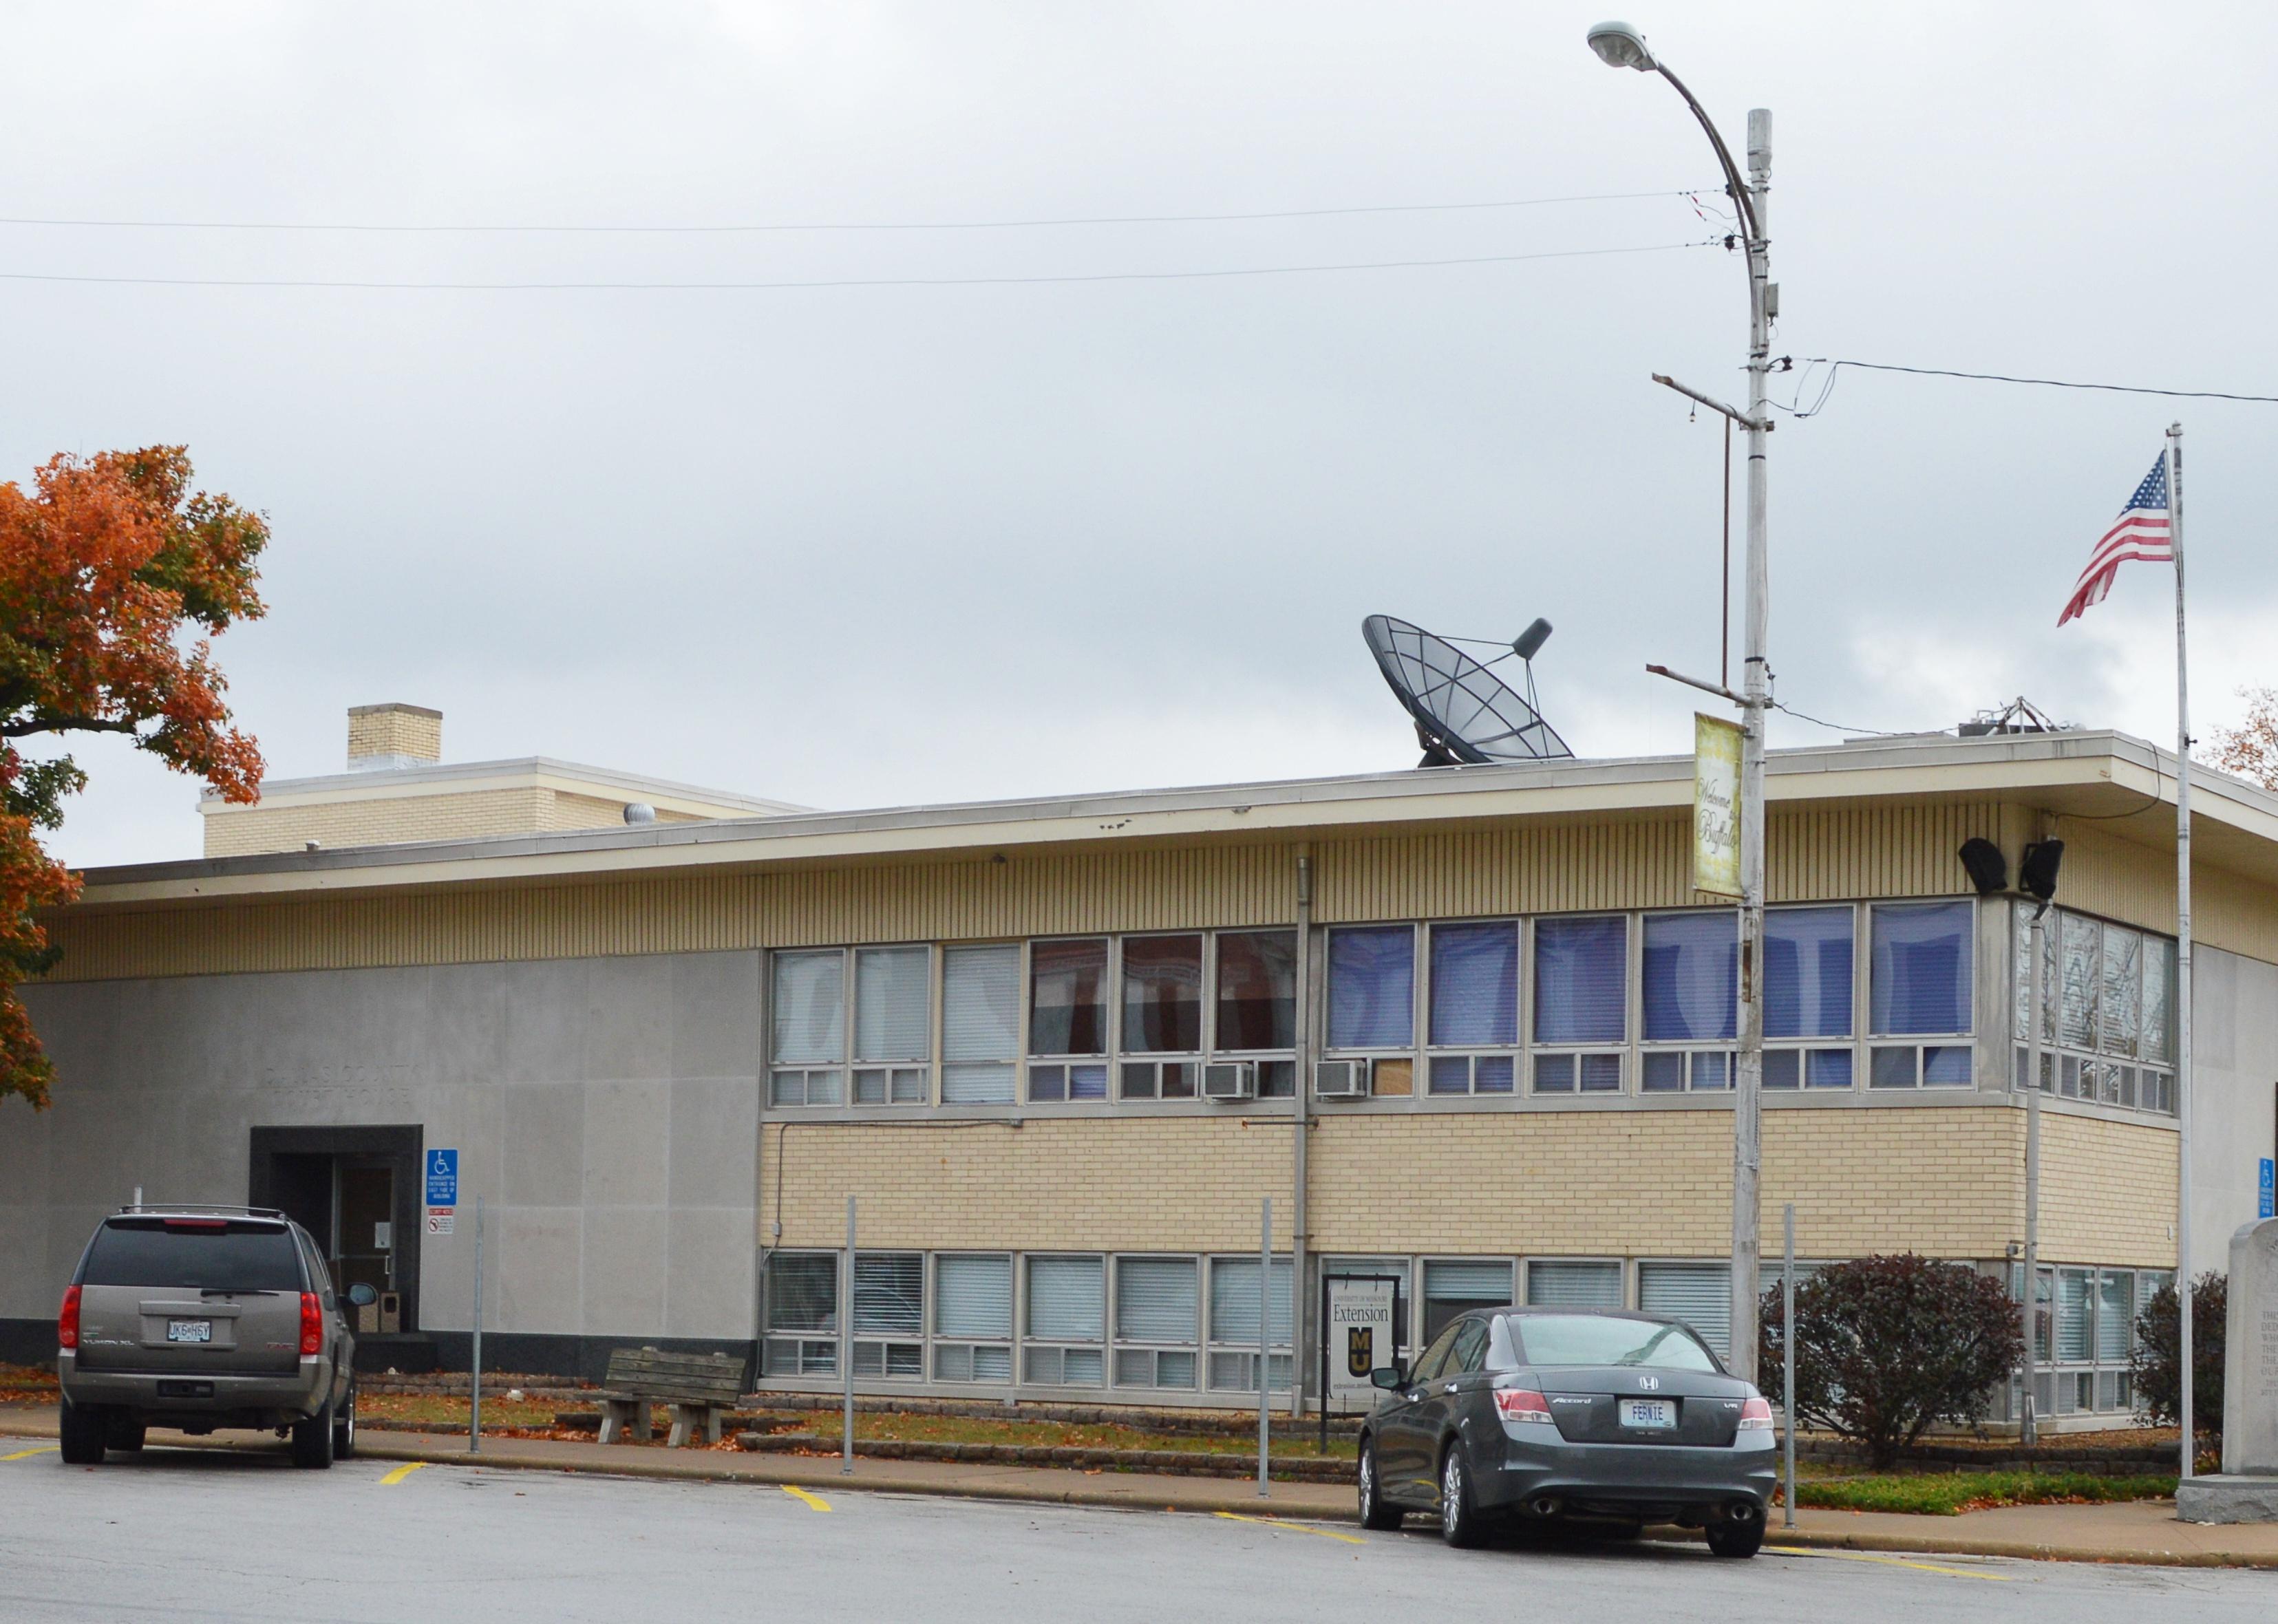
#48. Barry County
– Emergency shelters per 100K people: 69.3 (24 shelters in database)
– Emergency shelter capacity per 100K: 7,776,048 people (2,694,245 total capacity)
– Shelters with generators: 0
– Shelters in 100-year floodplain: 0

Lisa Fitzthum Photography // Shutterstock
#47. Camden County
– Emergency shelters per 100K people: 69.7 (30 shelters in database)
– Emergency shelter capacity per 100K: 20,465,405 people (8,810,971 total capacity)
– Shelters with generators: 0
– Shelters in 100-year floodplain: 0

Kbh3rd // Wikimedia Commons
#46. Franklin County
– Emergency shelters per 100K people: 70.0 (73 shelters in database)
– Emergency shelter capacity per 100K: 7,705,029 people (8,038,734 total capacity)
– Shelters with generators: 4
– Shelters in 100-year floodplain: 0

Kbh3rd // Wikimedia Commons
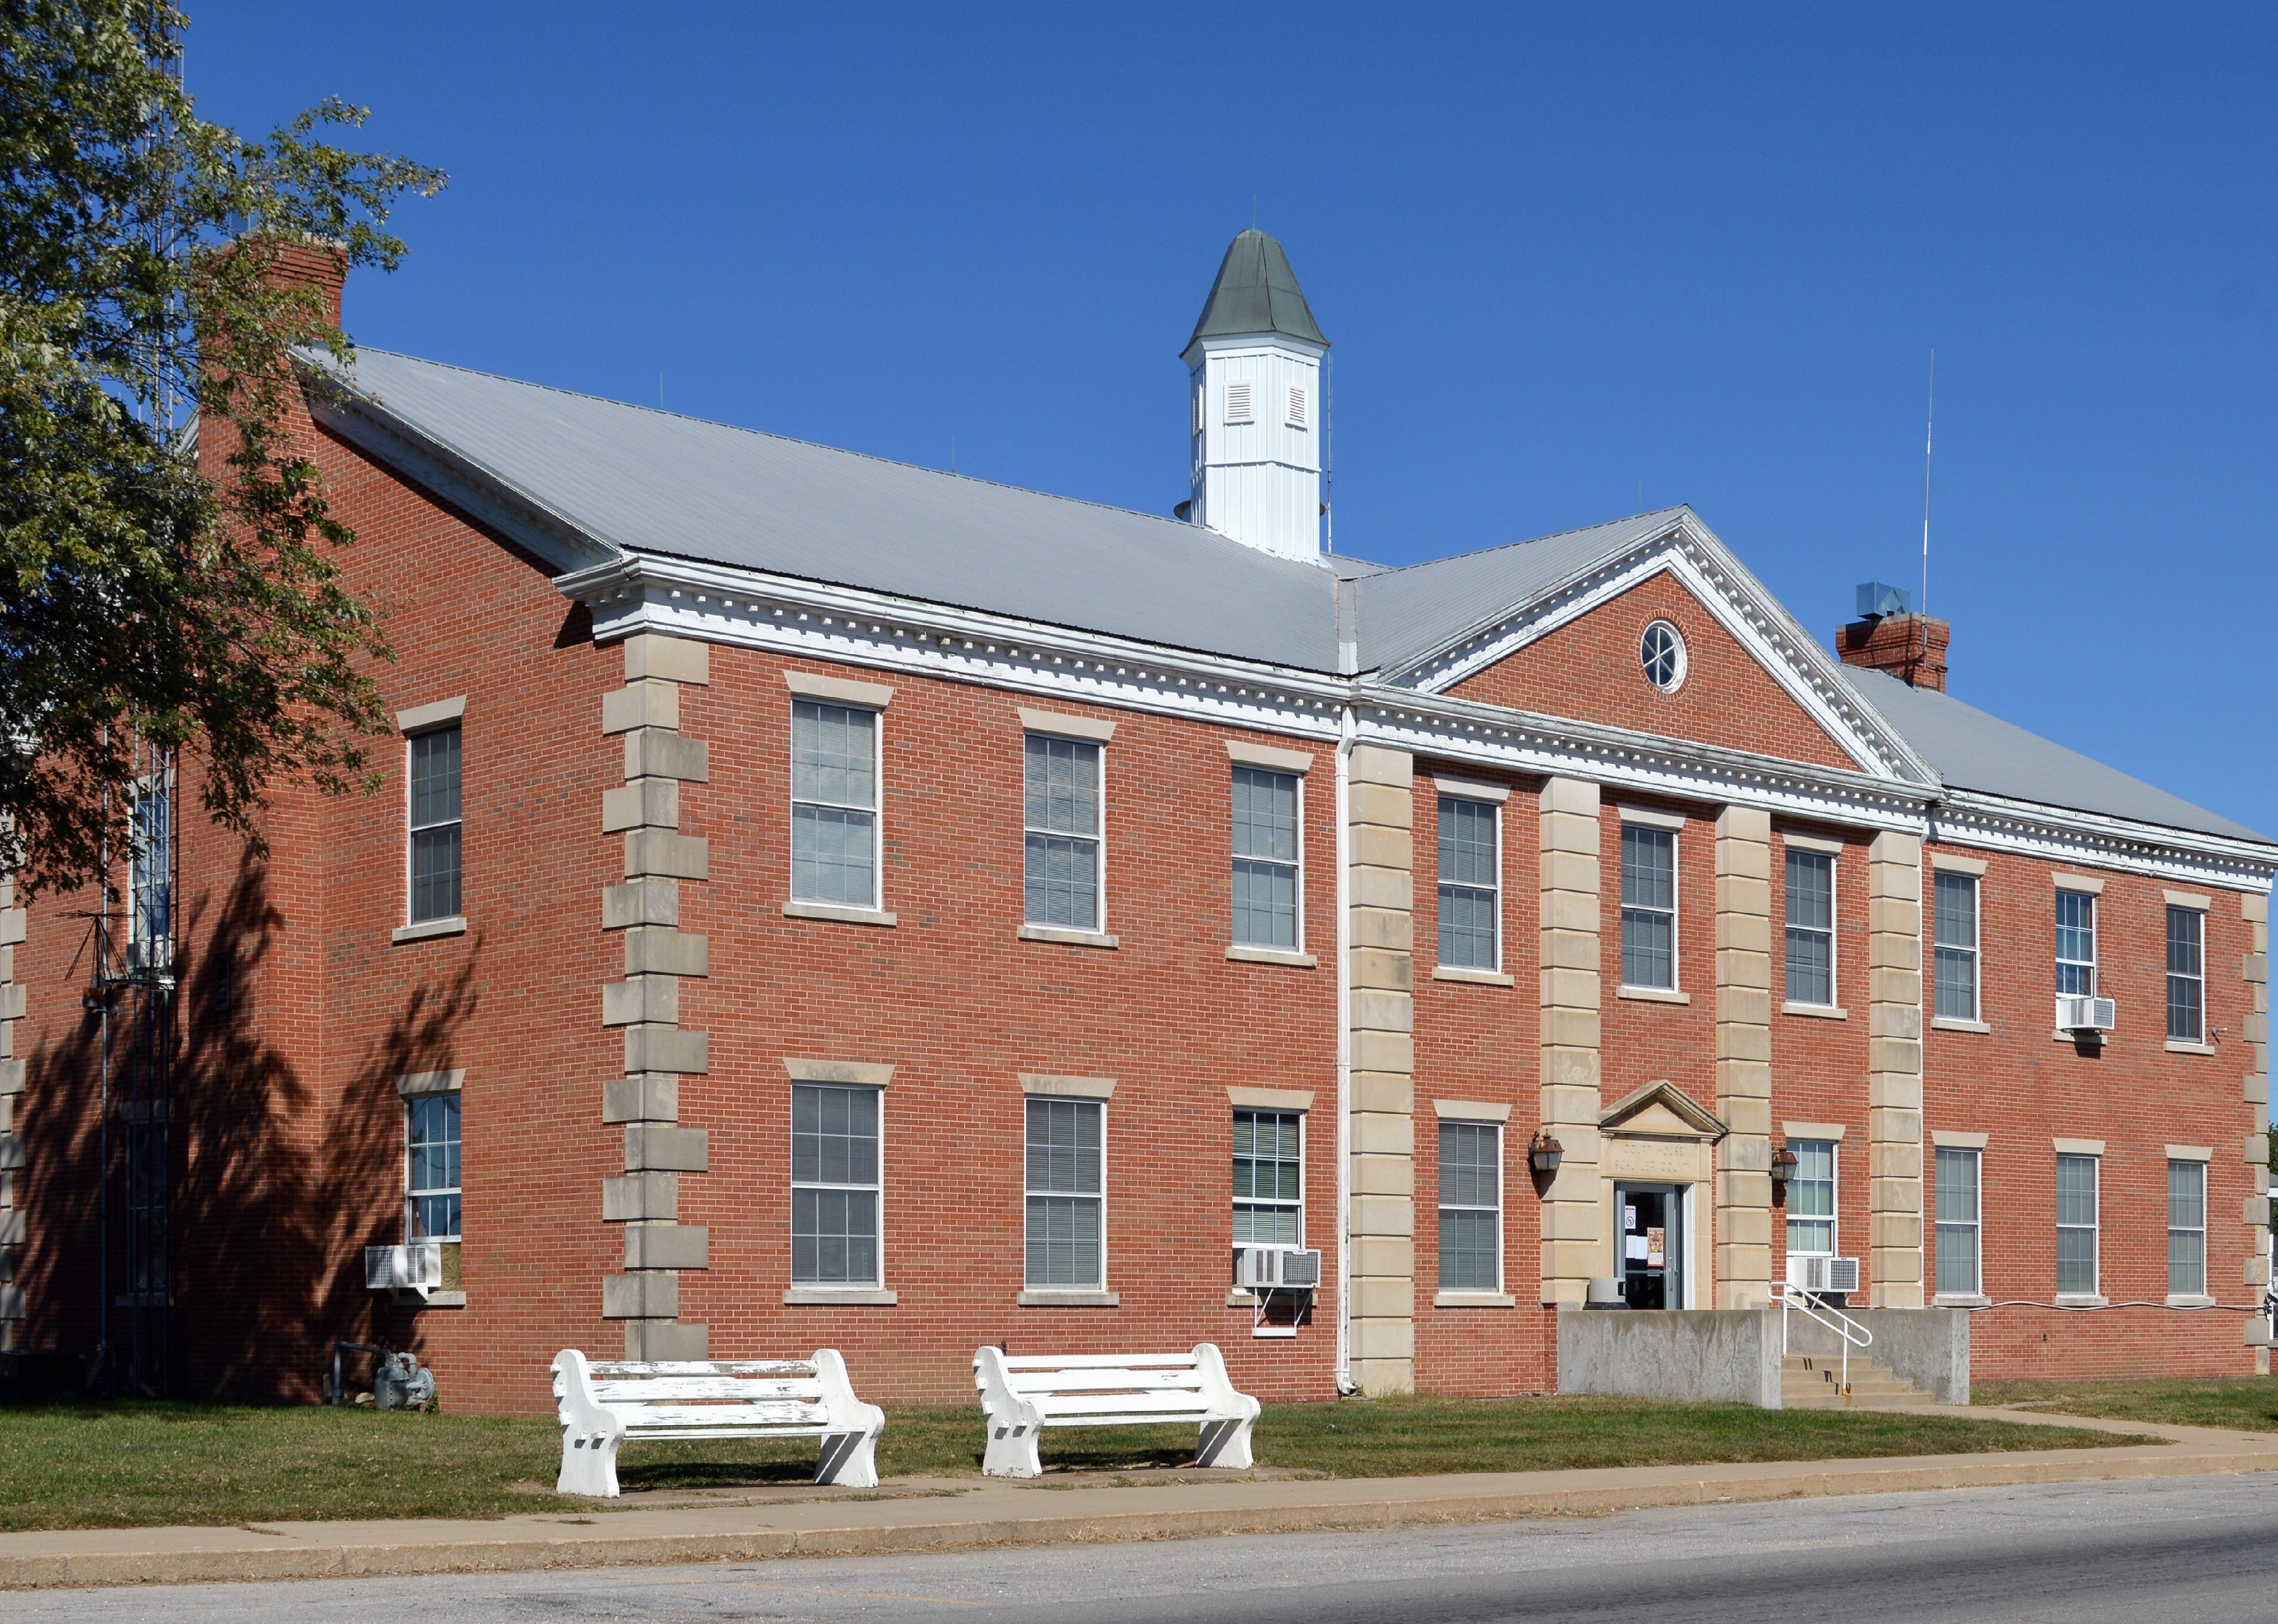
#45. Wayne County
– Emergency shelters per 100K people: 70.8 (8 shelters in database)
– Emergency shelter capacity per 100K: 18,077,235 people (2,042,366 total capacity)
– Shelters with generators: 1
– Shelters in 100-year floodplain: 0
Kbh3rd // Wikimedia Commons
#44. Dallas County
– Emergency shelters per 100K people: 70.8 (12 shelters in database)
– Emergency shelter capacity per 100K: 8,833,560 people (1,496,935 total capacity)
– Shelters with generators: 0
– Shelters in 100-year floodplain: 0

Brian Hunter // Wikimedia Commons
#43. Benton County
– Emergency shelters per 100K people: 72.3 (14 shelters in database)
– Emergency shelter capacity per 100K: 12,700,687 people (2,457,710 total capacity)
– Shelters with generators: 1
– Shelters in 100-year floodplain: 0

M. Curtis // Shutterstock
#42. Laclede County
– Emergency shelters per 100K people: 72.4 (26 shelters in database)
– Emergency shelter capacity per 100K: 9,425,698 people (3,383,637 total capacity)
– Shelters with generators: 1
– Shelters in 100-year floodplain: 0
Kbh3rd // Wikimedia Commons
#41. Schuyler County
– Emergency shelters per 100K people: 73.3 (3 shelters in database)
– Emergency shelter capacity per 100K: 25,928,139 people (1,061,498 total capacity)
– Shelters with generators: 0
– Shelters in 100-year floodplain: 0

Kbh3rd // Wikimedia Commons
#40. Dunklin County
– Emergency shelters per 100K people: 73.4 (21 shelters in database)
– Emergency shelter capacity per 100K: 12,488,371 people (3,570,675 total capacity)
– Shelters with generators: 1
– Shelters in 100-year floodplain: 1
Markkaempfer // Wikimedia Commons
#39. Perry County
– Emergency shelters per 100K people: 73.7 (14 shelters in database)
– Emergency shelter capacity per 100K: 8,808,549 people (1,674,241 total capacity)
– Shelters with generators: 0
– Shelters in 100-year floodplain: 0
Kbh3rd // Wikimedia Commons
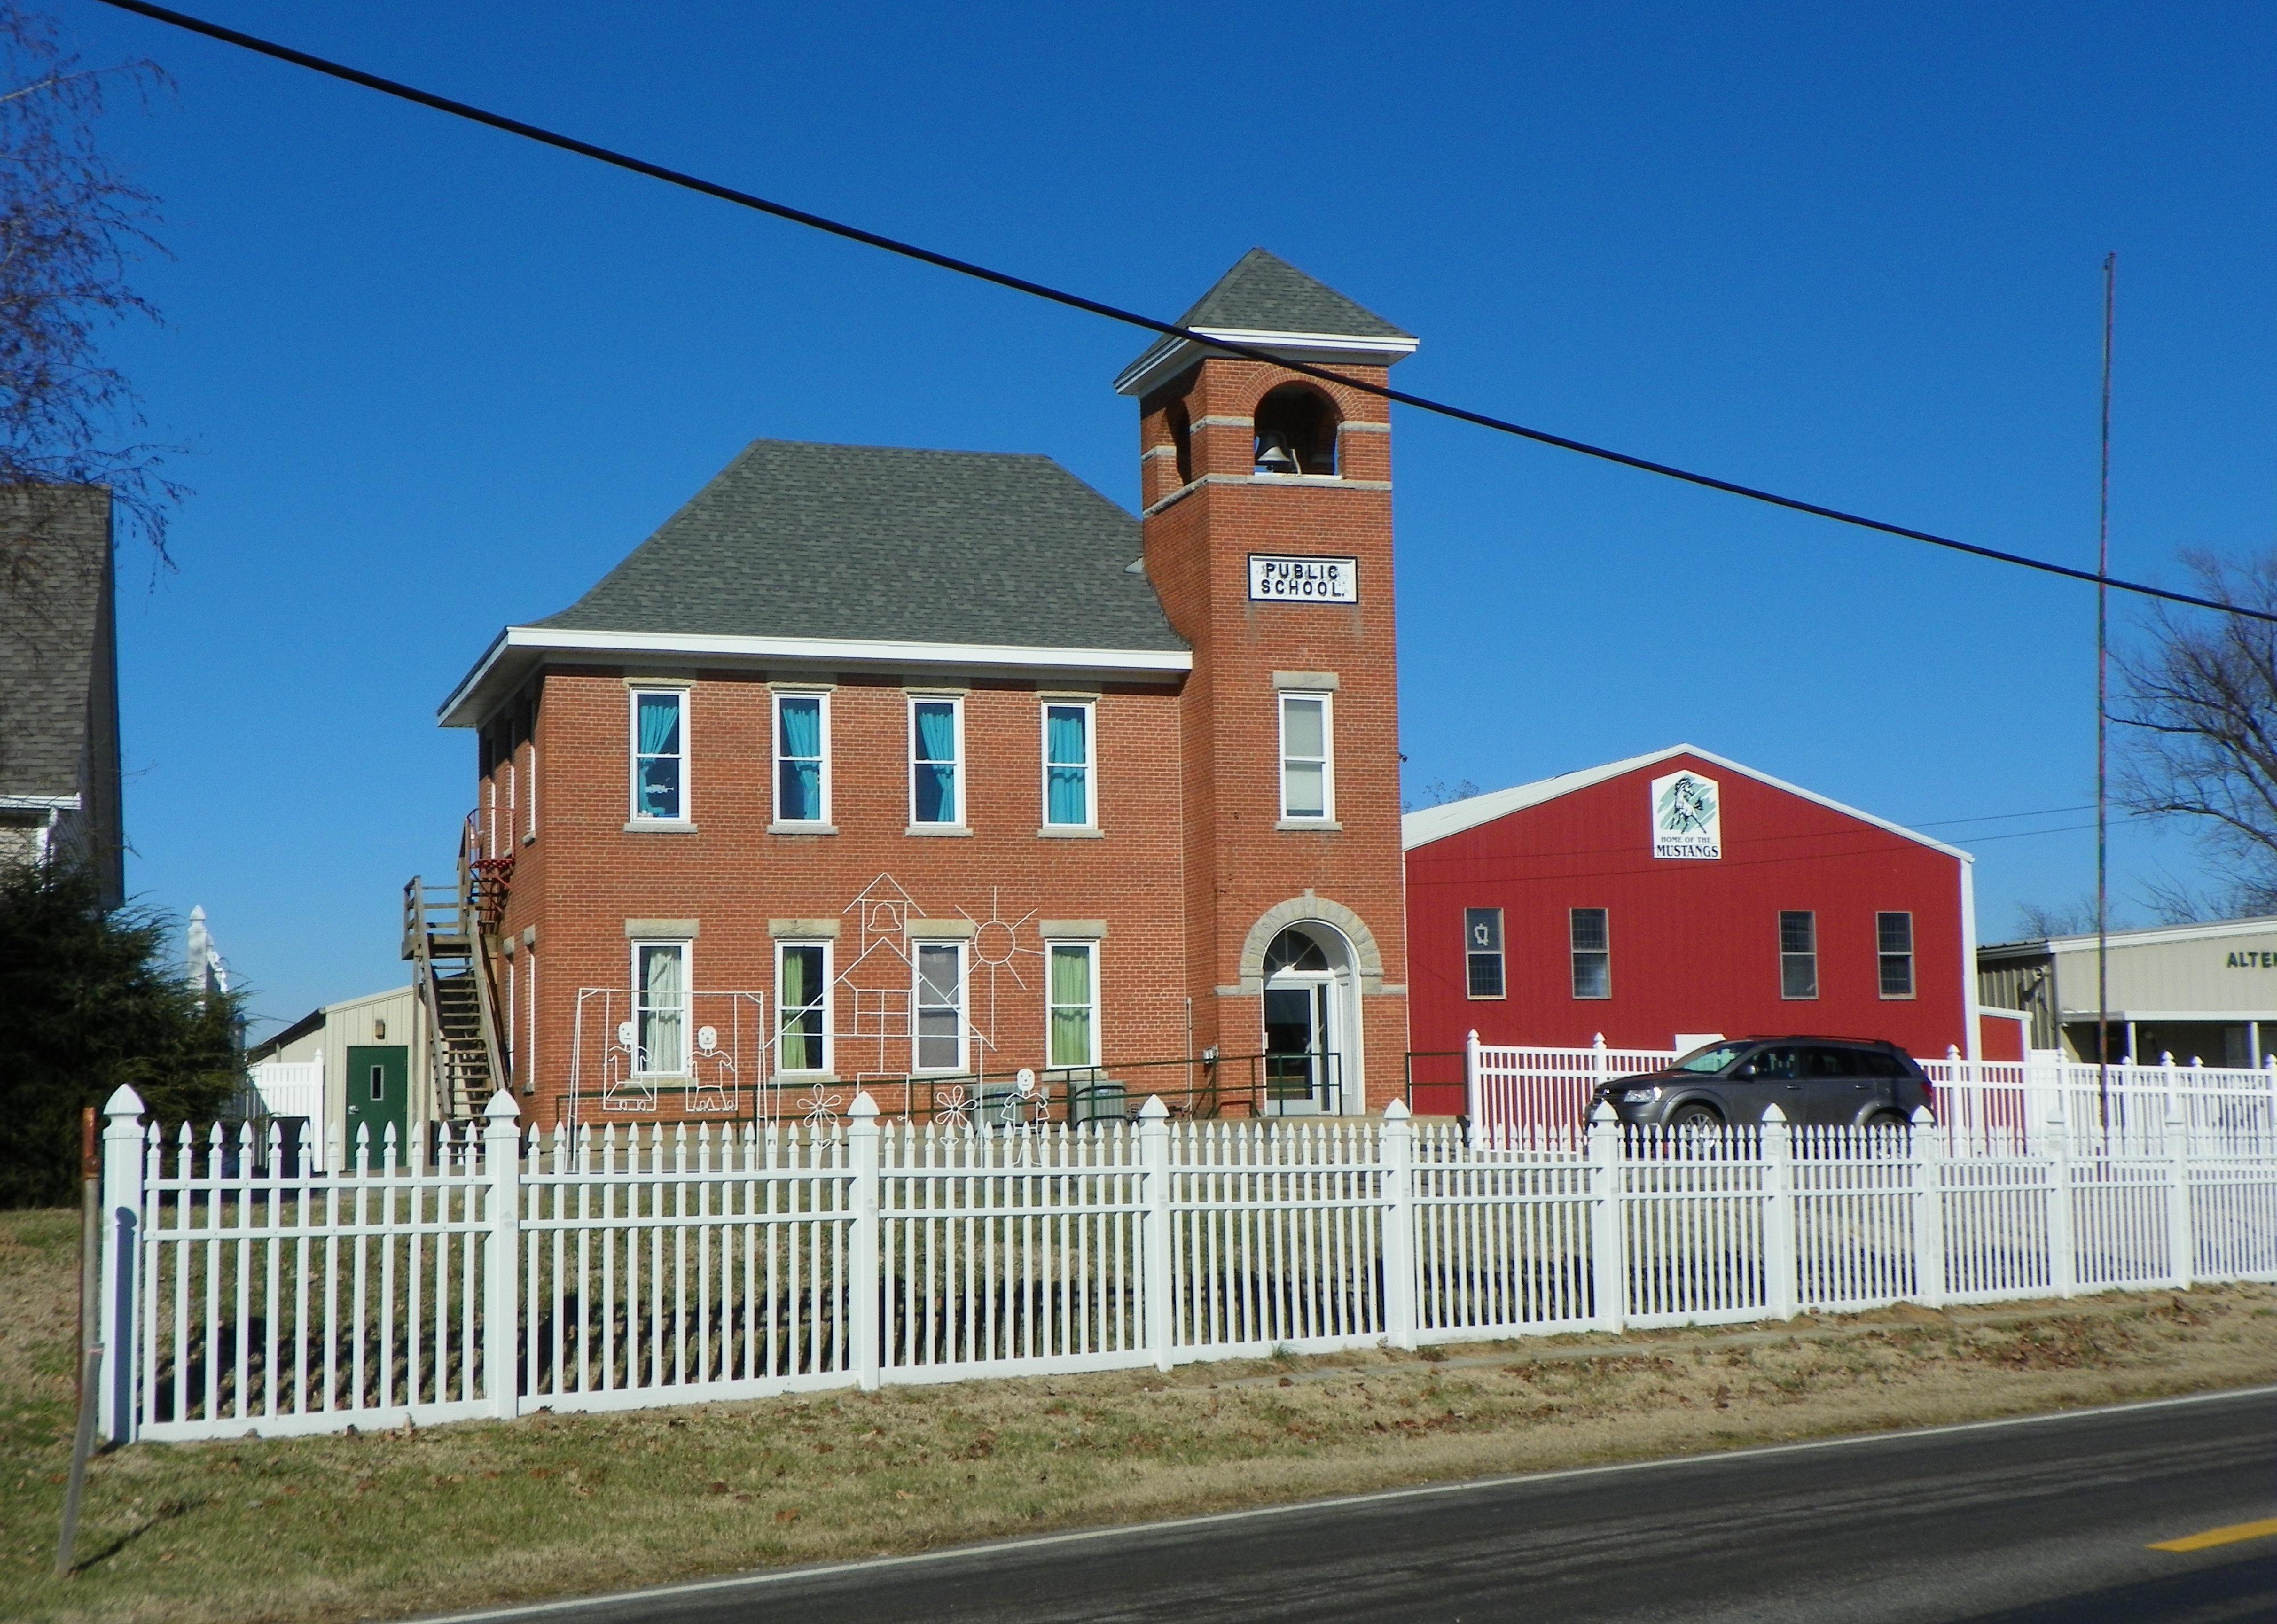
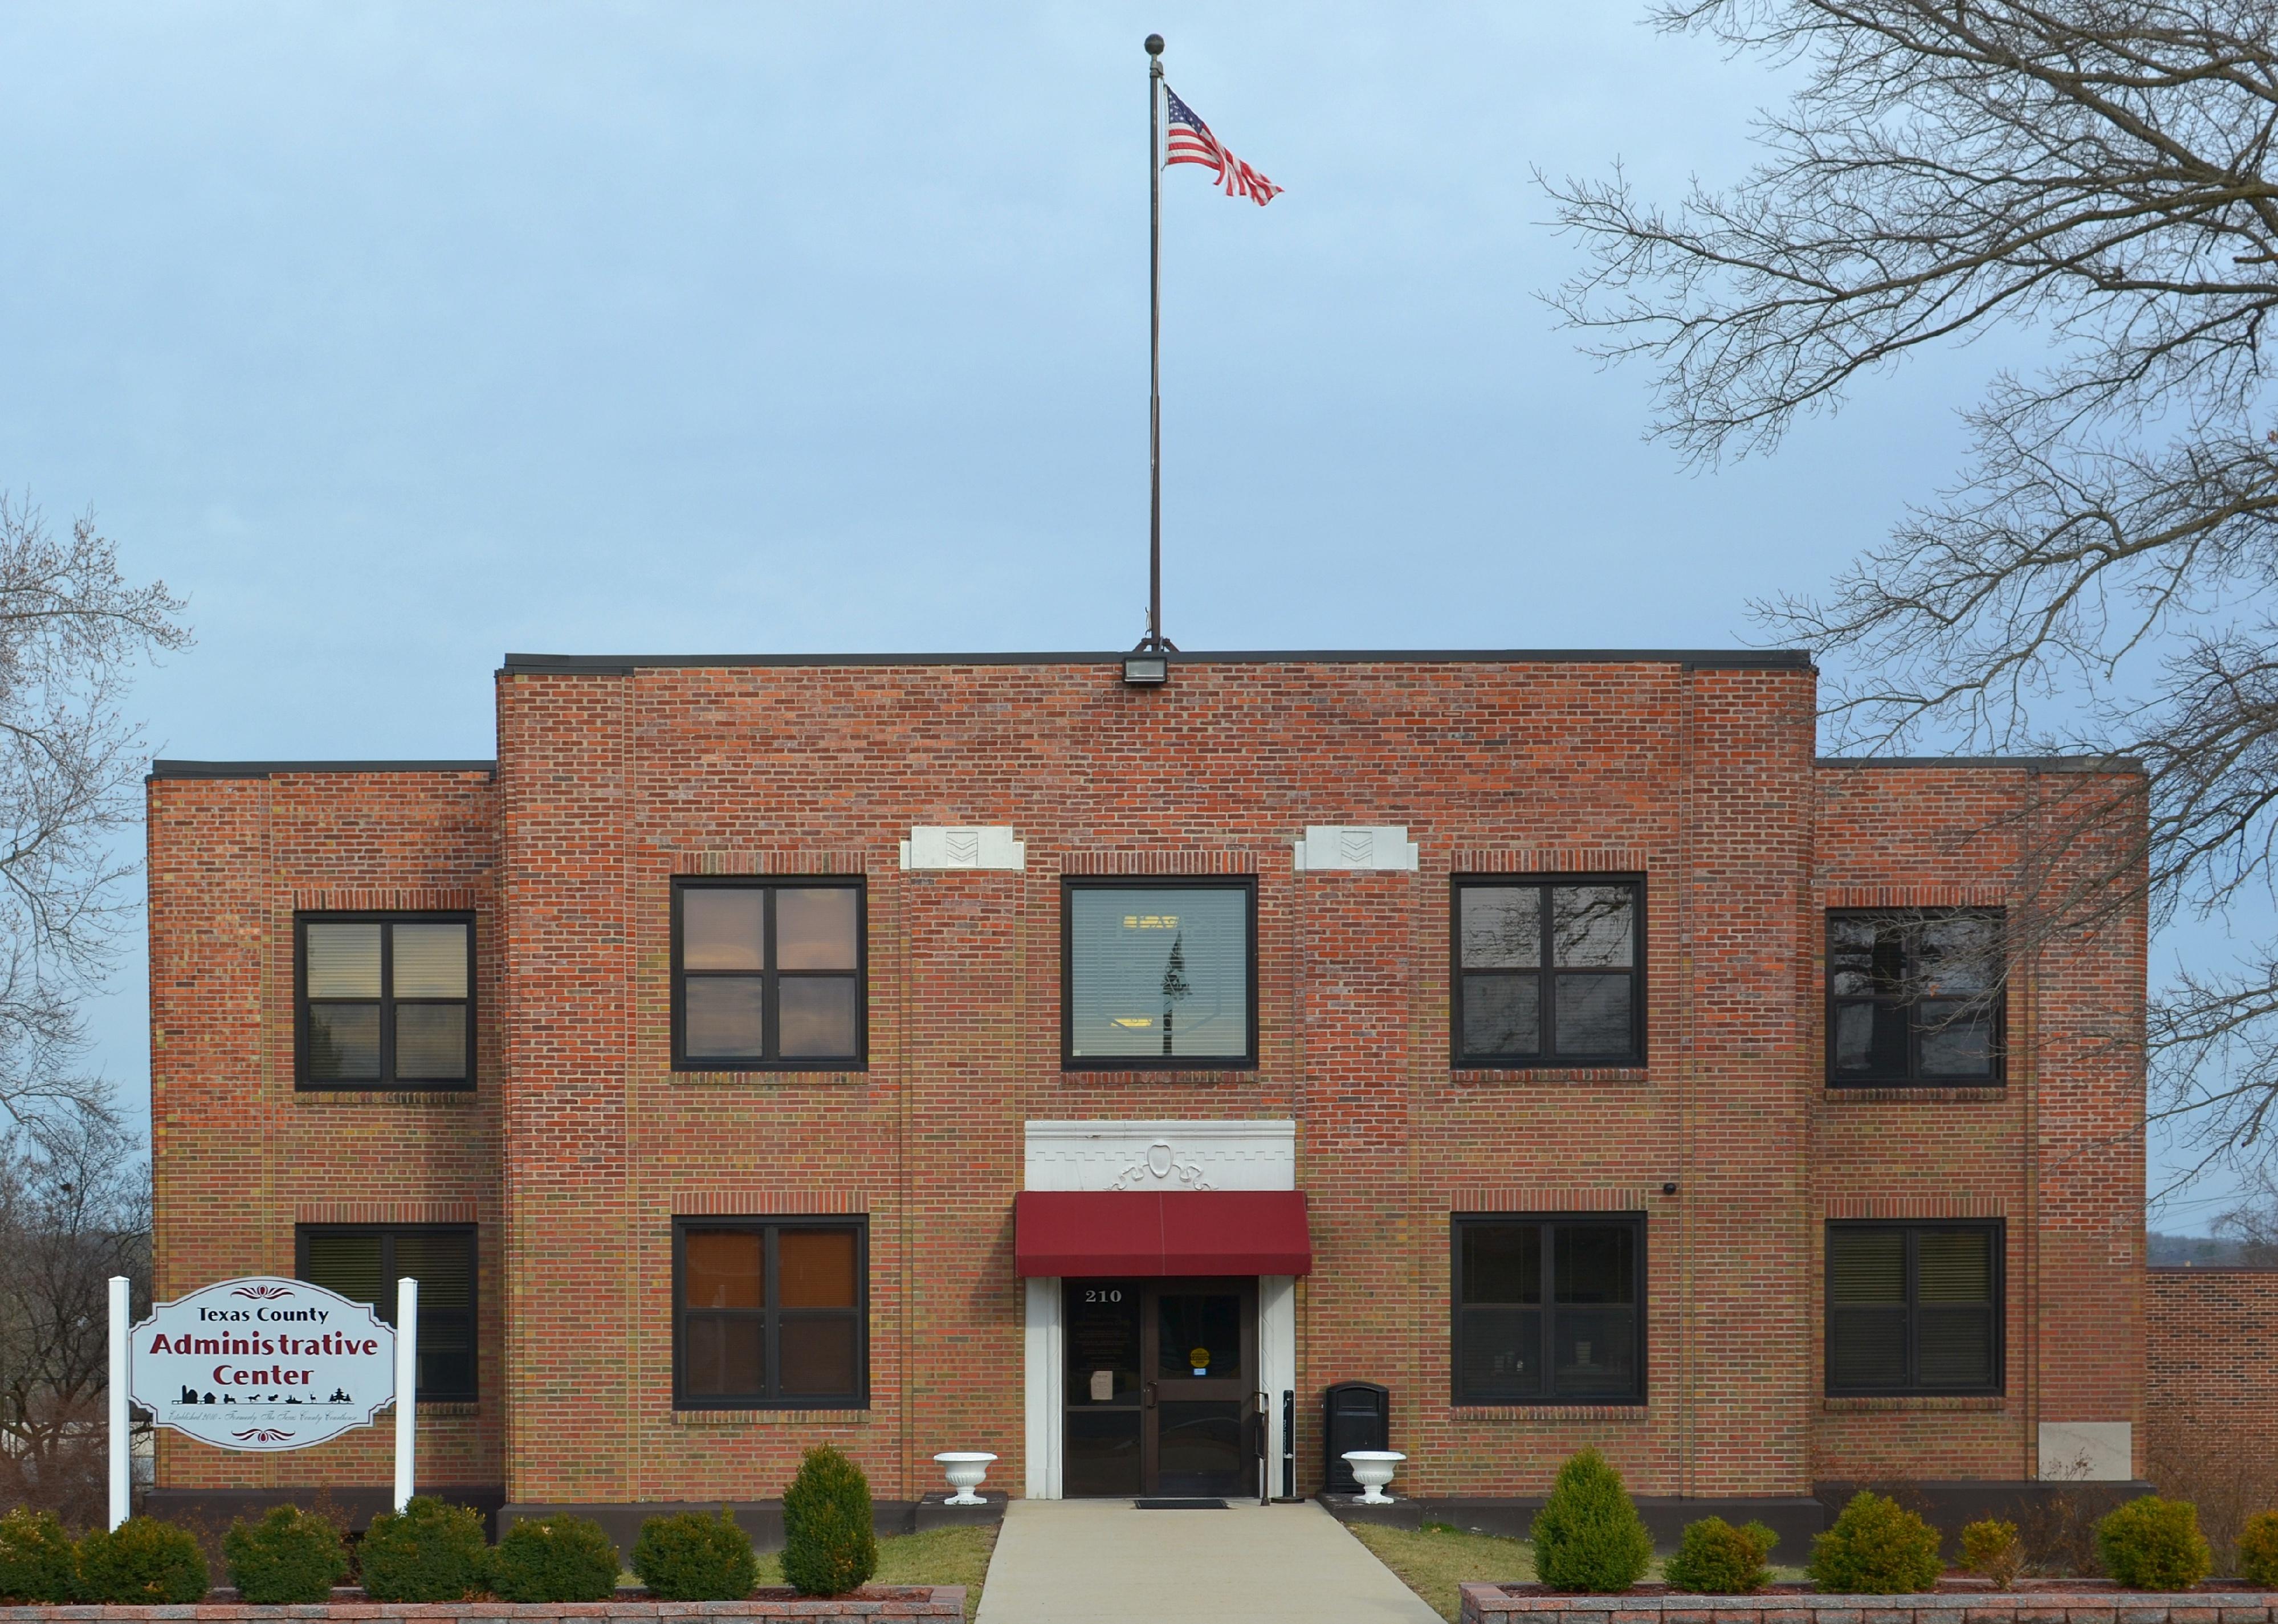
#38. Texas County
– Emergency shelters per 100K people: 76.4 (19 shelters in database)
– Emergency shelter capacity per 100K: 9,847,720 people (2,448,734 total capacity)
– Shelters with generators: 0
– Shelters in 100-year floodplain: 0
Rcool1234 // Wikimedia Commons
#37. Andrew County
– Emergency shelters per 100K people: 77.7 (14 shelters in database)
– Emergency shelter capacity per 100K: 9,171,004 people (1,652,890 total capacity)
– Shelters with generators: 0
– Shelters in 100-year floodplain: 0
Kbh3rd // Wikimedia Commons
#36. Lawrence County
– Emergency shelters per 100K people: 78.7 (30 shelters in database)
– Emergency shelter capacity per 100K: 9,388,107 people (3,579,028 total capacity)
– Shelters with generators: 0
– Shelters in 100-year floodplain: 0
Kbh3rd // Wikimedia Commons
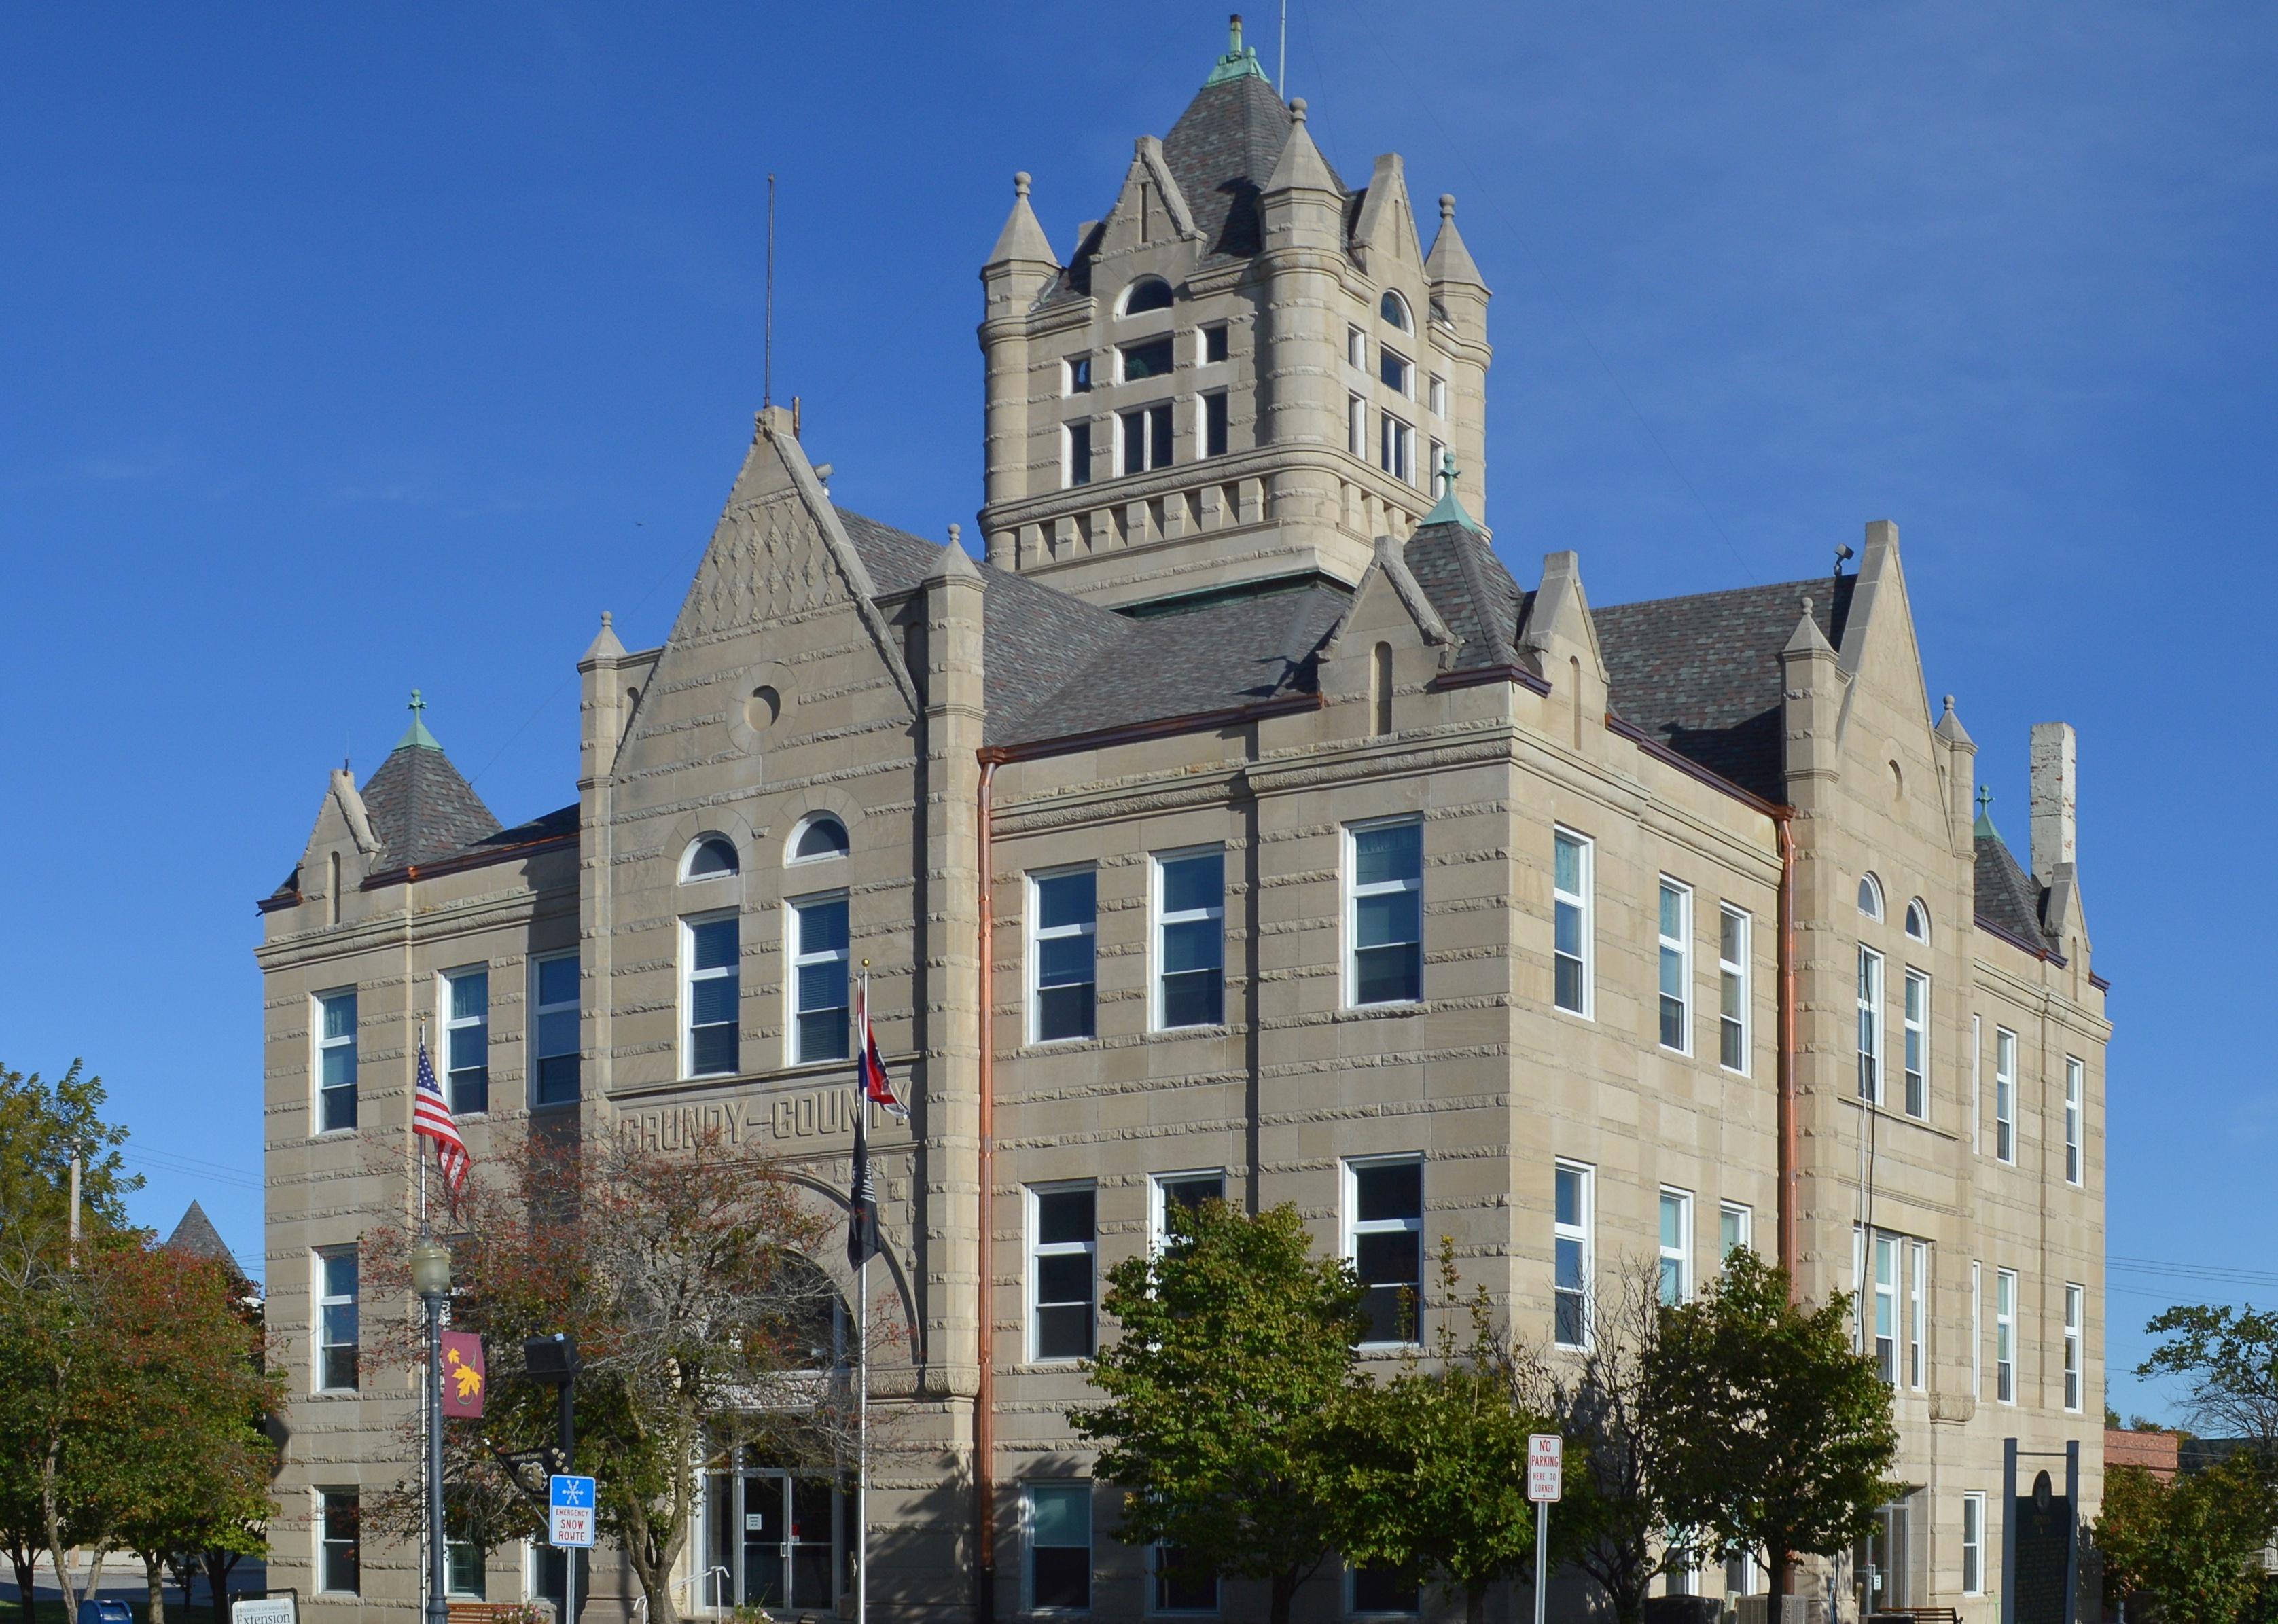
#35. Grundy County
– Emergency shelters per 100K people: 80.8 (8 shelters in database)
– Emergency shelter capacity per 100K: 10,993,960 people (1,088,512 total capacity)
– Shelters with generators: 0
– Shelters in 100-year floodplain: 0
Kbh3rd // Wikimedia Commons
#34. Reynolds County
– Emergency shelters per 100K people: 81.5 (5 shelters in database)
– Emergency shelter capacity per 100K: 27,637,471 people (1,696,388 total capacity)
– Shelters with generators: 0
– Shelters in 100-year floodplain: 0
~ (The Rebel At) ~ // Wikimedia Commons
#33. Moniteau County
– Emergency shelters per 100K people: 82.7 (13 shelters in database)
– Emergency shelter capacity per 100K: 14,750,060 people (2,319,152 total capacity)
– Shelters with generators: 0
– Shelters in 100-year floodplain: 0
Charles W. Chapman // Wikimedia Commons
#32. Audrain County
– Emergency shelters per 100K people: 83.3 (21 shelters in database)
– Emergency shelter capacity per 100K: 24,010,407 people (6,056,145 total capacity)
– Shelters with generators: 0
– Shelters in 100-year floodplain: 0
Brian Stansberry // Wikimedia Commons
#31. Mississippi County
– Emergency shelters per 100K people: 84.8 (11 shelters in database)
– Emergency shelter capacity per 100K: 21,330,973 people (2,767,907 total capacity)
– Shelters with generators: 0
– Shelters in 100-year floodplain: 0

Kbh3rd // Wikimedia Commons
#30. Putnam County
– Emergency shelters per 100K people: 84.8 (4 shelters in database)
– Emergency shelter capacity per 100K: 29,738,303 people (1,402,161 total capacity)
– Shelters with generators: 0
– Shelters in 100-year floodplain: 0
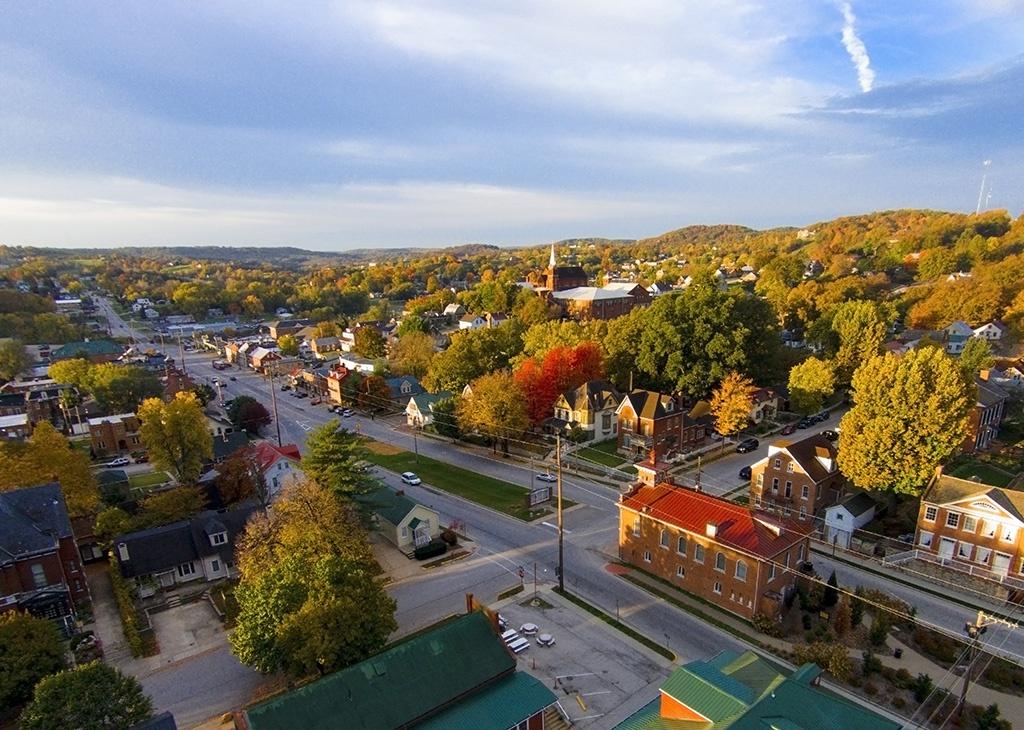
Paul Sableman // Wikimedia Commons
#29. Cooper County
– Emergency shelters per 100K people: 86.2 (15 shelters in database)
– Emergency shelter capacity per 100K: 19,962,557 people (3,472,886 total capacity)
– Shelters with generators: 0
– Shelters in 100-year floodplain: 0
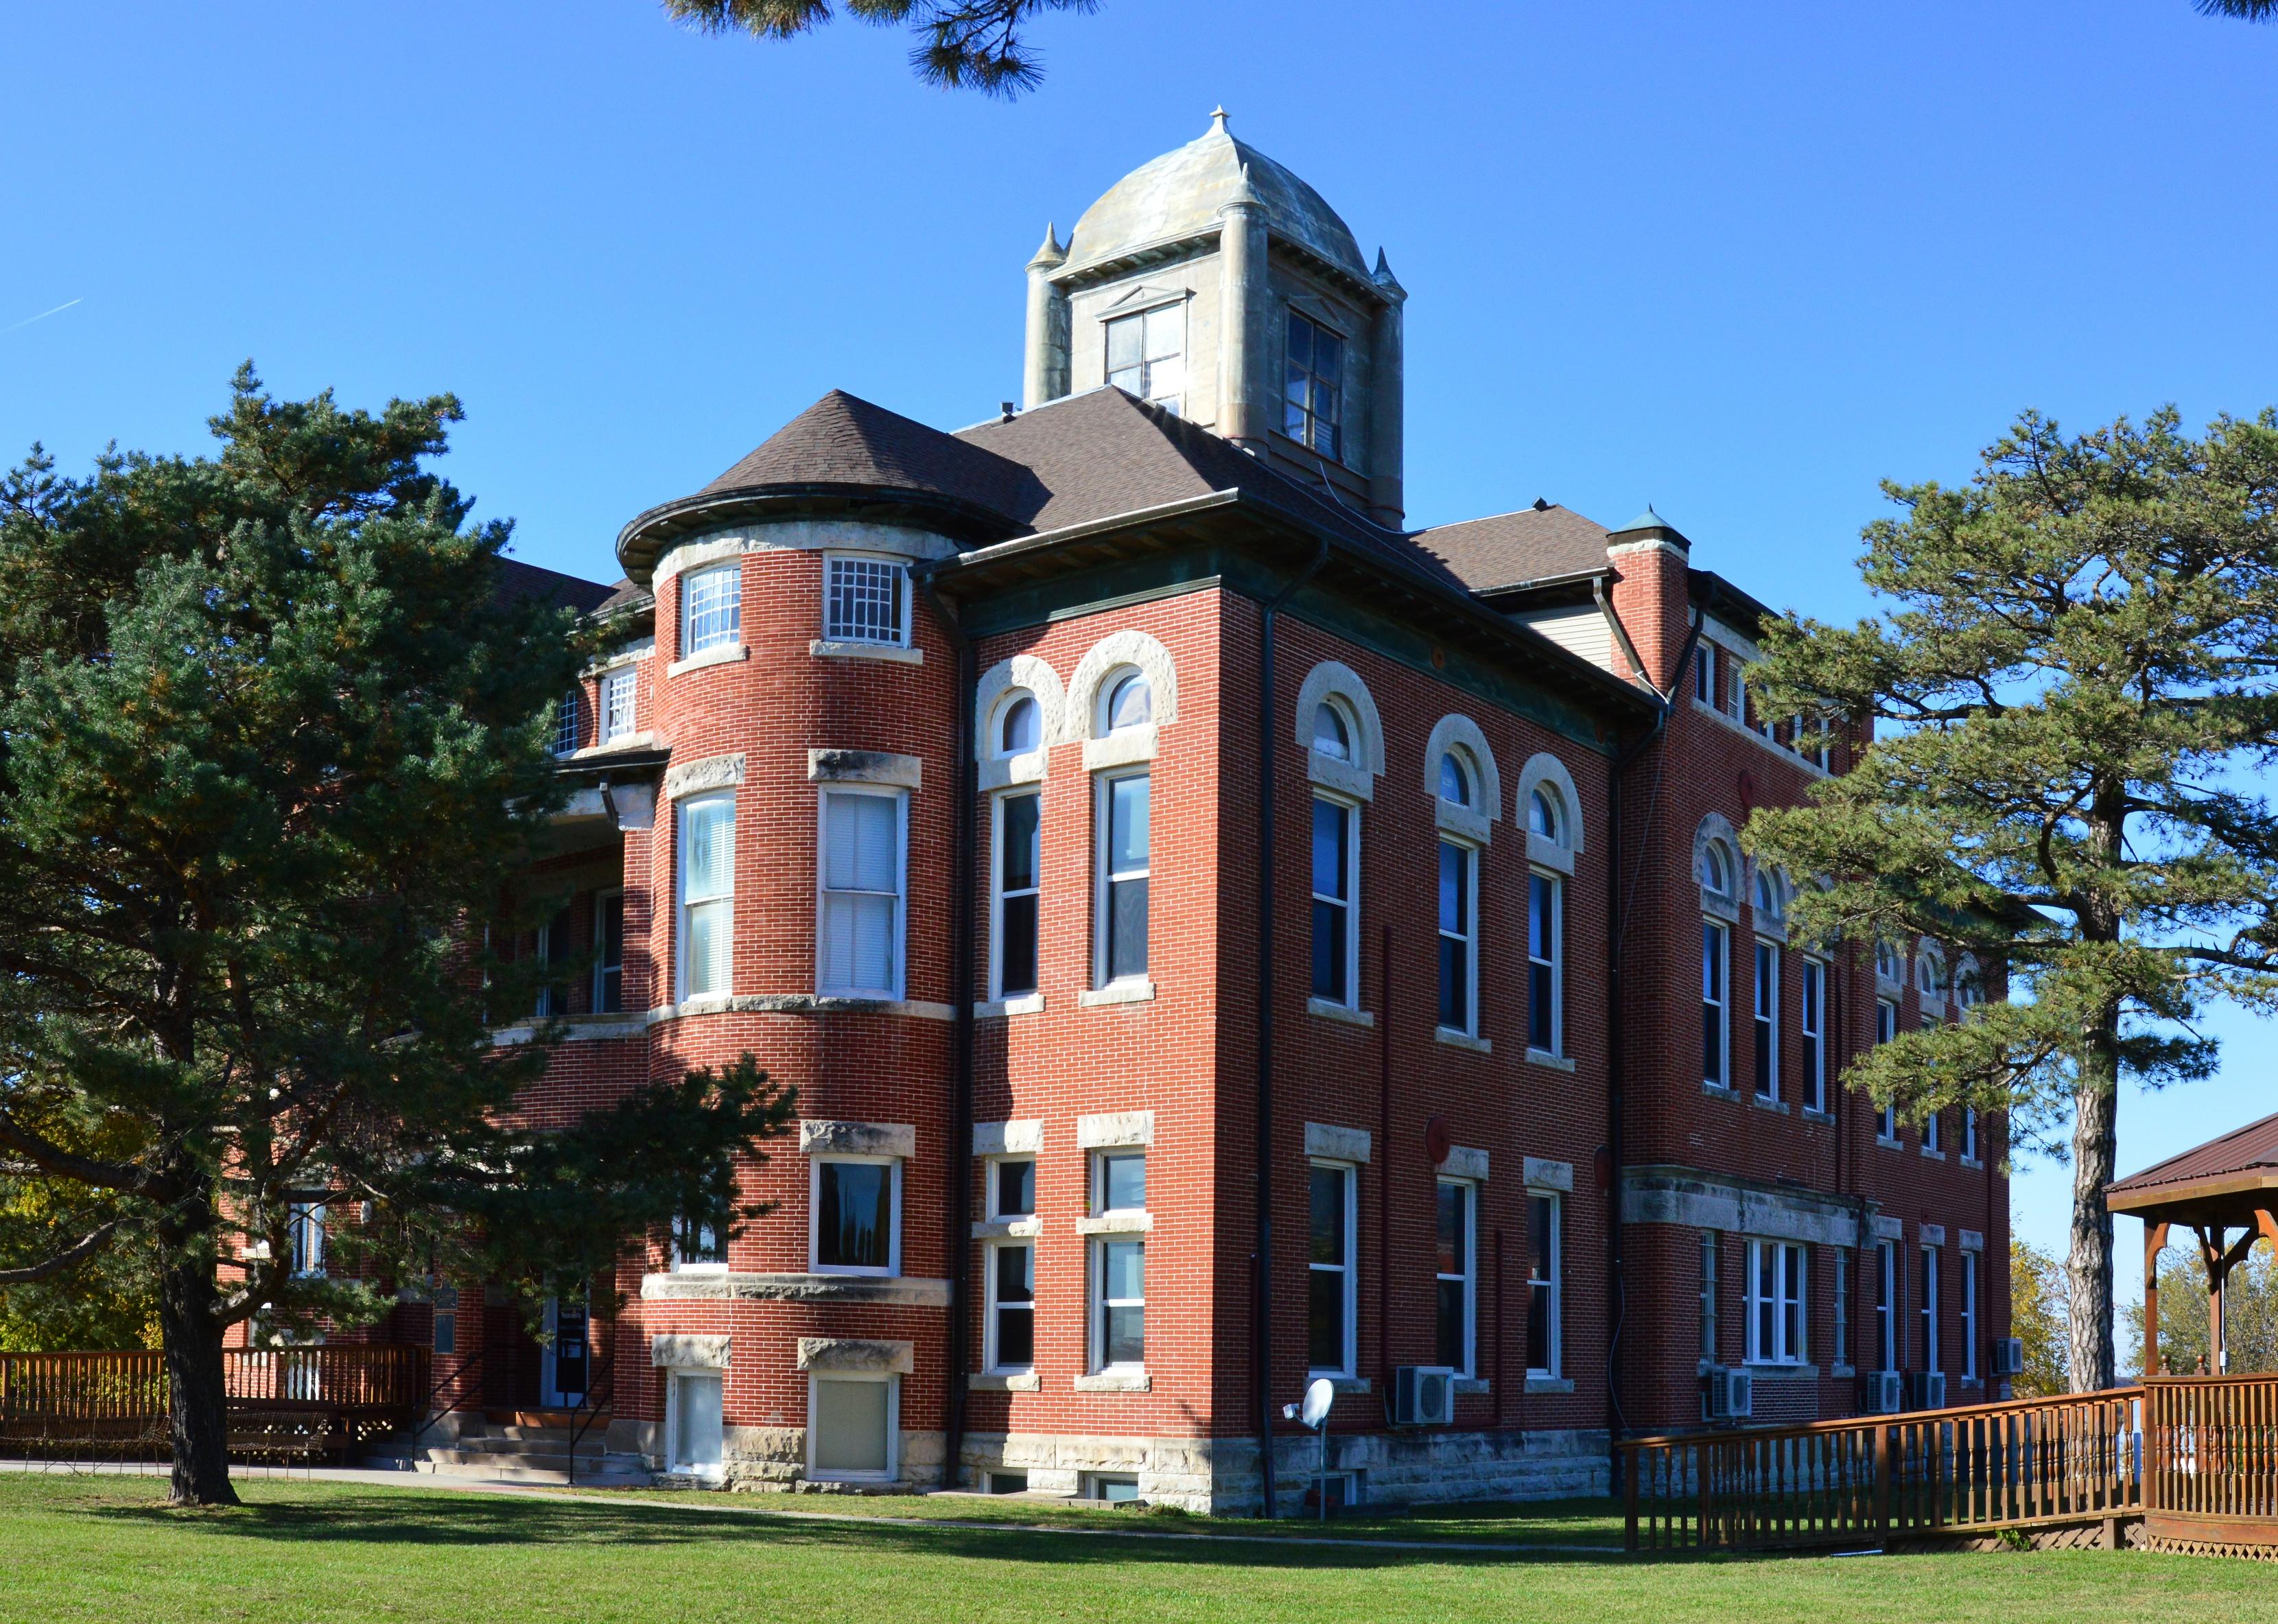
Davekeiser // Wikimedia Commons
#28. Gasconade County
– Emergency shelters per 100K people: 87.8 (13 shelters in database)
– Emergency shelter capacity per 100K: 9,142,032 people (1,353,295 total capacity)
– Shelters with generators: 0
– Shelters in 100-year floodplain: 0

Kbh3rd // Wikimedia Commons
#27. Montgomery County
– Emergency shelters per 100K people: 87.8 (10 shelters in database)
– Emergency shelter capacity per 100K: 28,559,496 people (3,251,213 total capacity)
– Shelters with generators: 0
– Shelters in 100-year floodplain: 0
Kbh3rd // Wikimedia Commons
#26. Caldwell County
– Emergency shelters per 100K people: 90.3 (8 shelters in database)
– Emergency shelter capacity per 100K: 12,261,405 people (1,085,870 total capacity)
– Shelters with generators: 1
– Shelters in 100-year floodplain: 0
Kbh3rd // Wikimedia Commons
#25. Crawford County
– Emergency shelters per 100K people: 90.5 (21 shelters in database)
– Emergency shelter capacity per 100K: 19,744,130 people (4,581,428 total capacity)
– Shelters with generators: 0
– Shelters in 100-year floodplain: 0

Kbh3rd // Wikimedia Commons
#24. Iron County
– Emergency shelters per 100K people: 93.7 (9 shelters in database)
– Emergency shelter capacity per 100K: 12,171,205 people (1,169,166 total capacity)
– Shelters with generators: 0
– Shelters in 100-year floodplain: 0
1807060460JCM // Wikimedia Commons
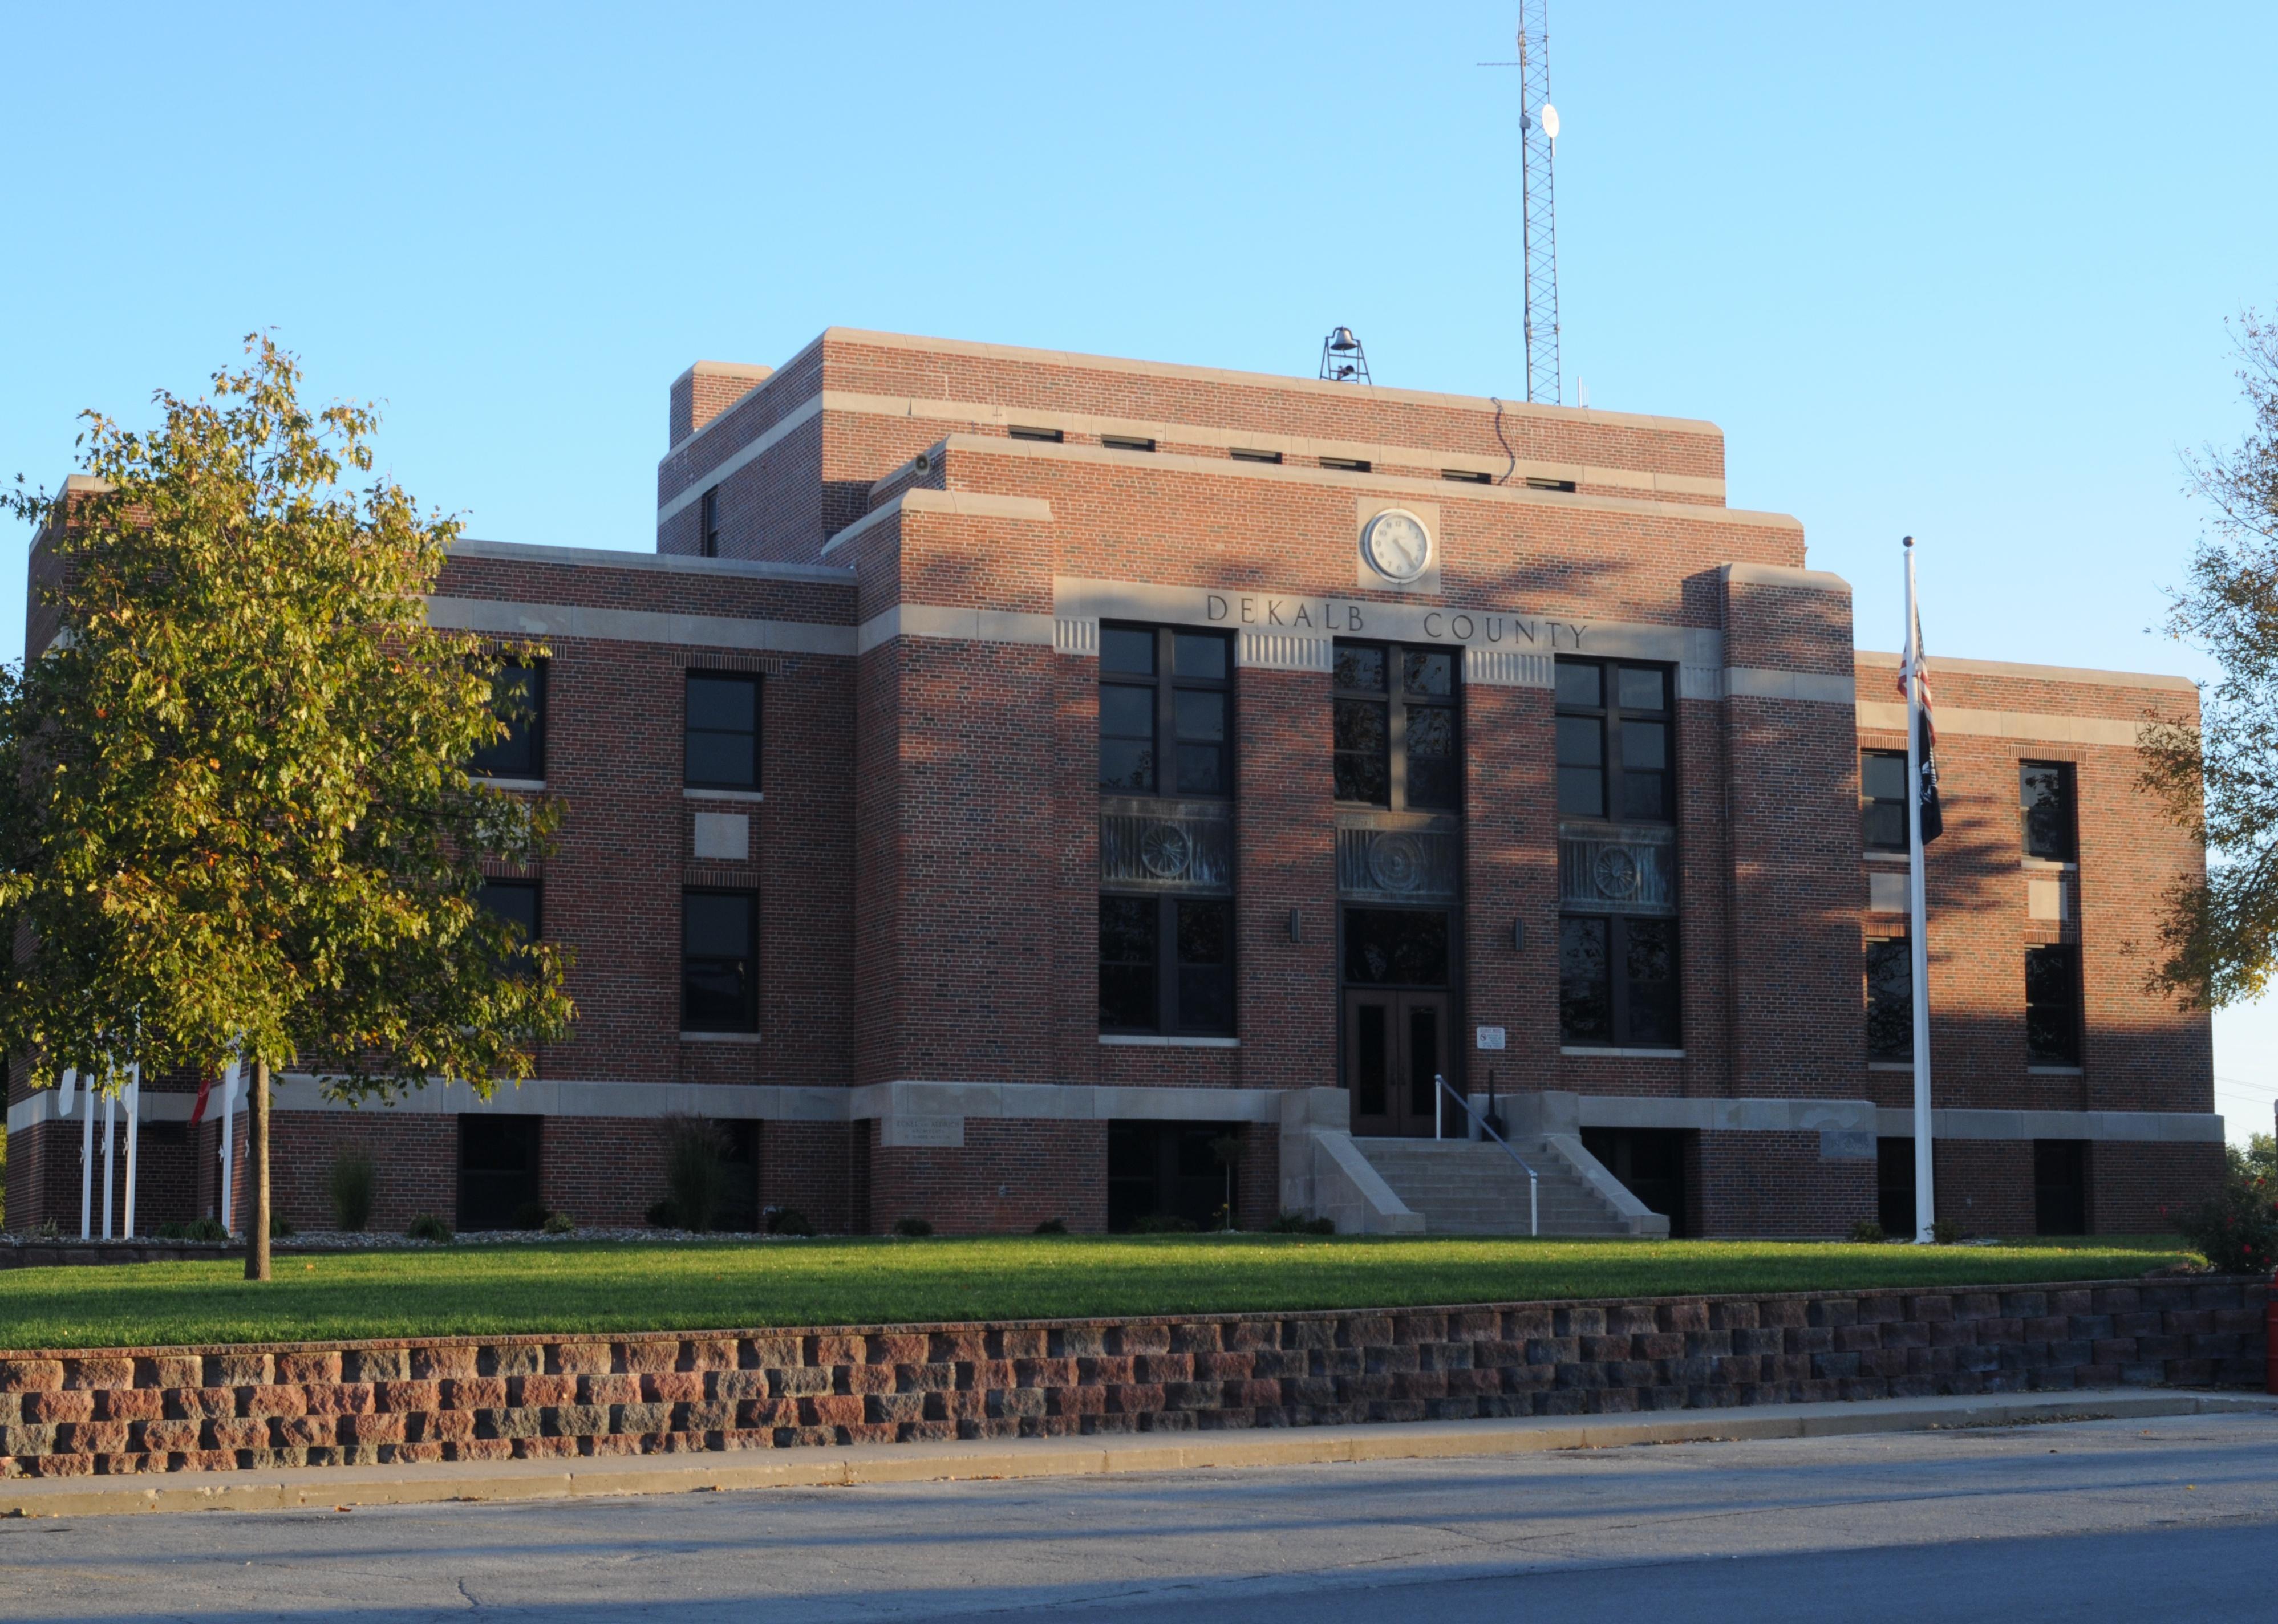
#23. DeKalb County
– Emergency shelters per 100K people: 94.5 (11 shelters in database)
– Emergency shelter capacity per 100K: 11,737,254 people (1,366,099 total capacity)
– Shelters with generators: 1
– Shelters in 100-year floodplain: 0

Kbh3rd // Wikimedia Commons
#22. Henry County
– Emergency shelters per 100K people: 96.0 (21 shelters in database)
– Emergency shelter capacity per 100K: 20,233,221 people (4,427,838 total capacity)
– Shelters with generators: 0
– Shelters in 100-year floodplain: 0
Kbh3rd // Wikimedia Commons
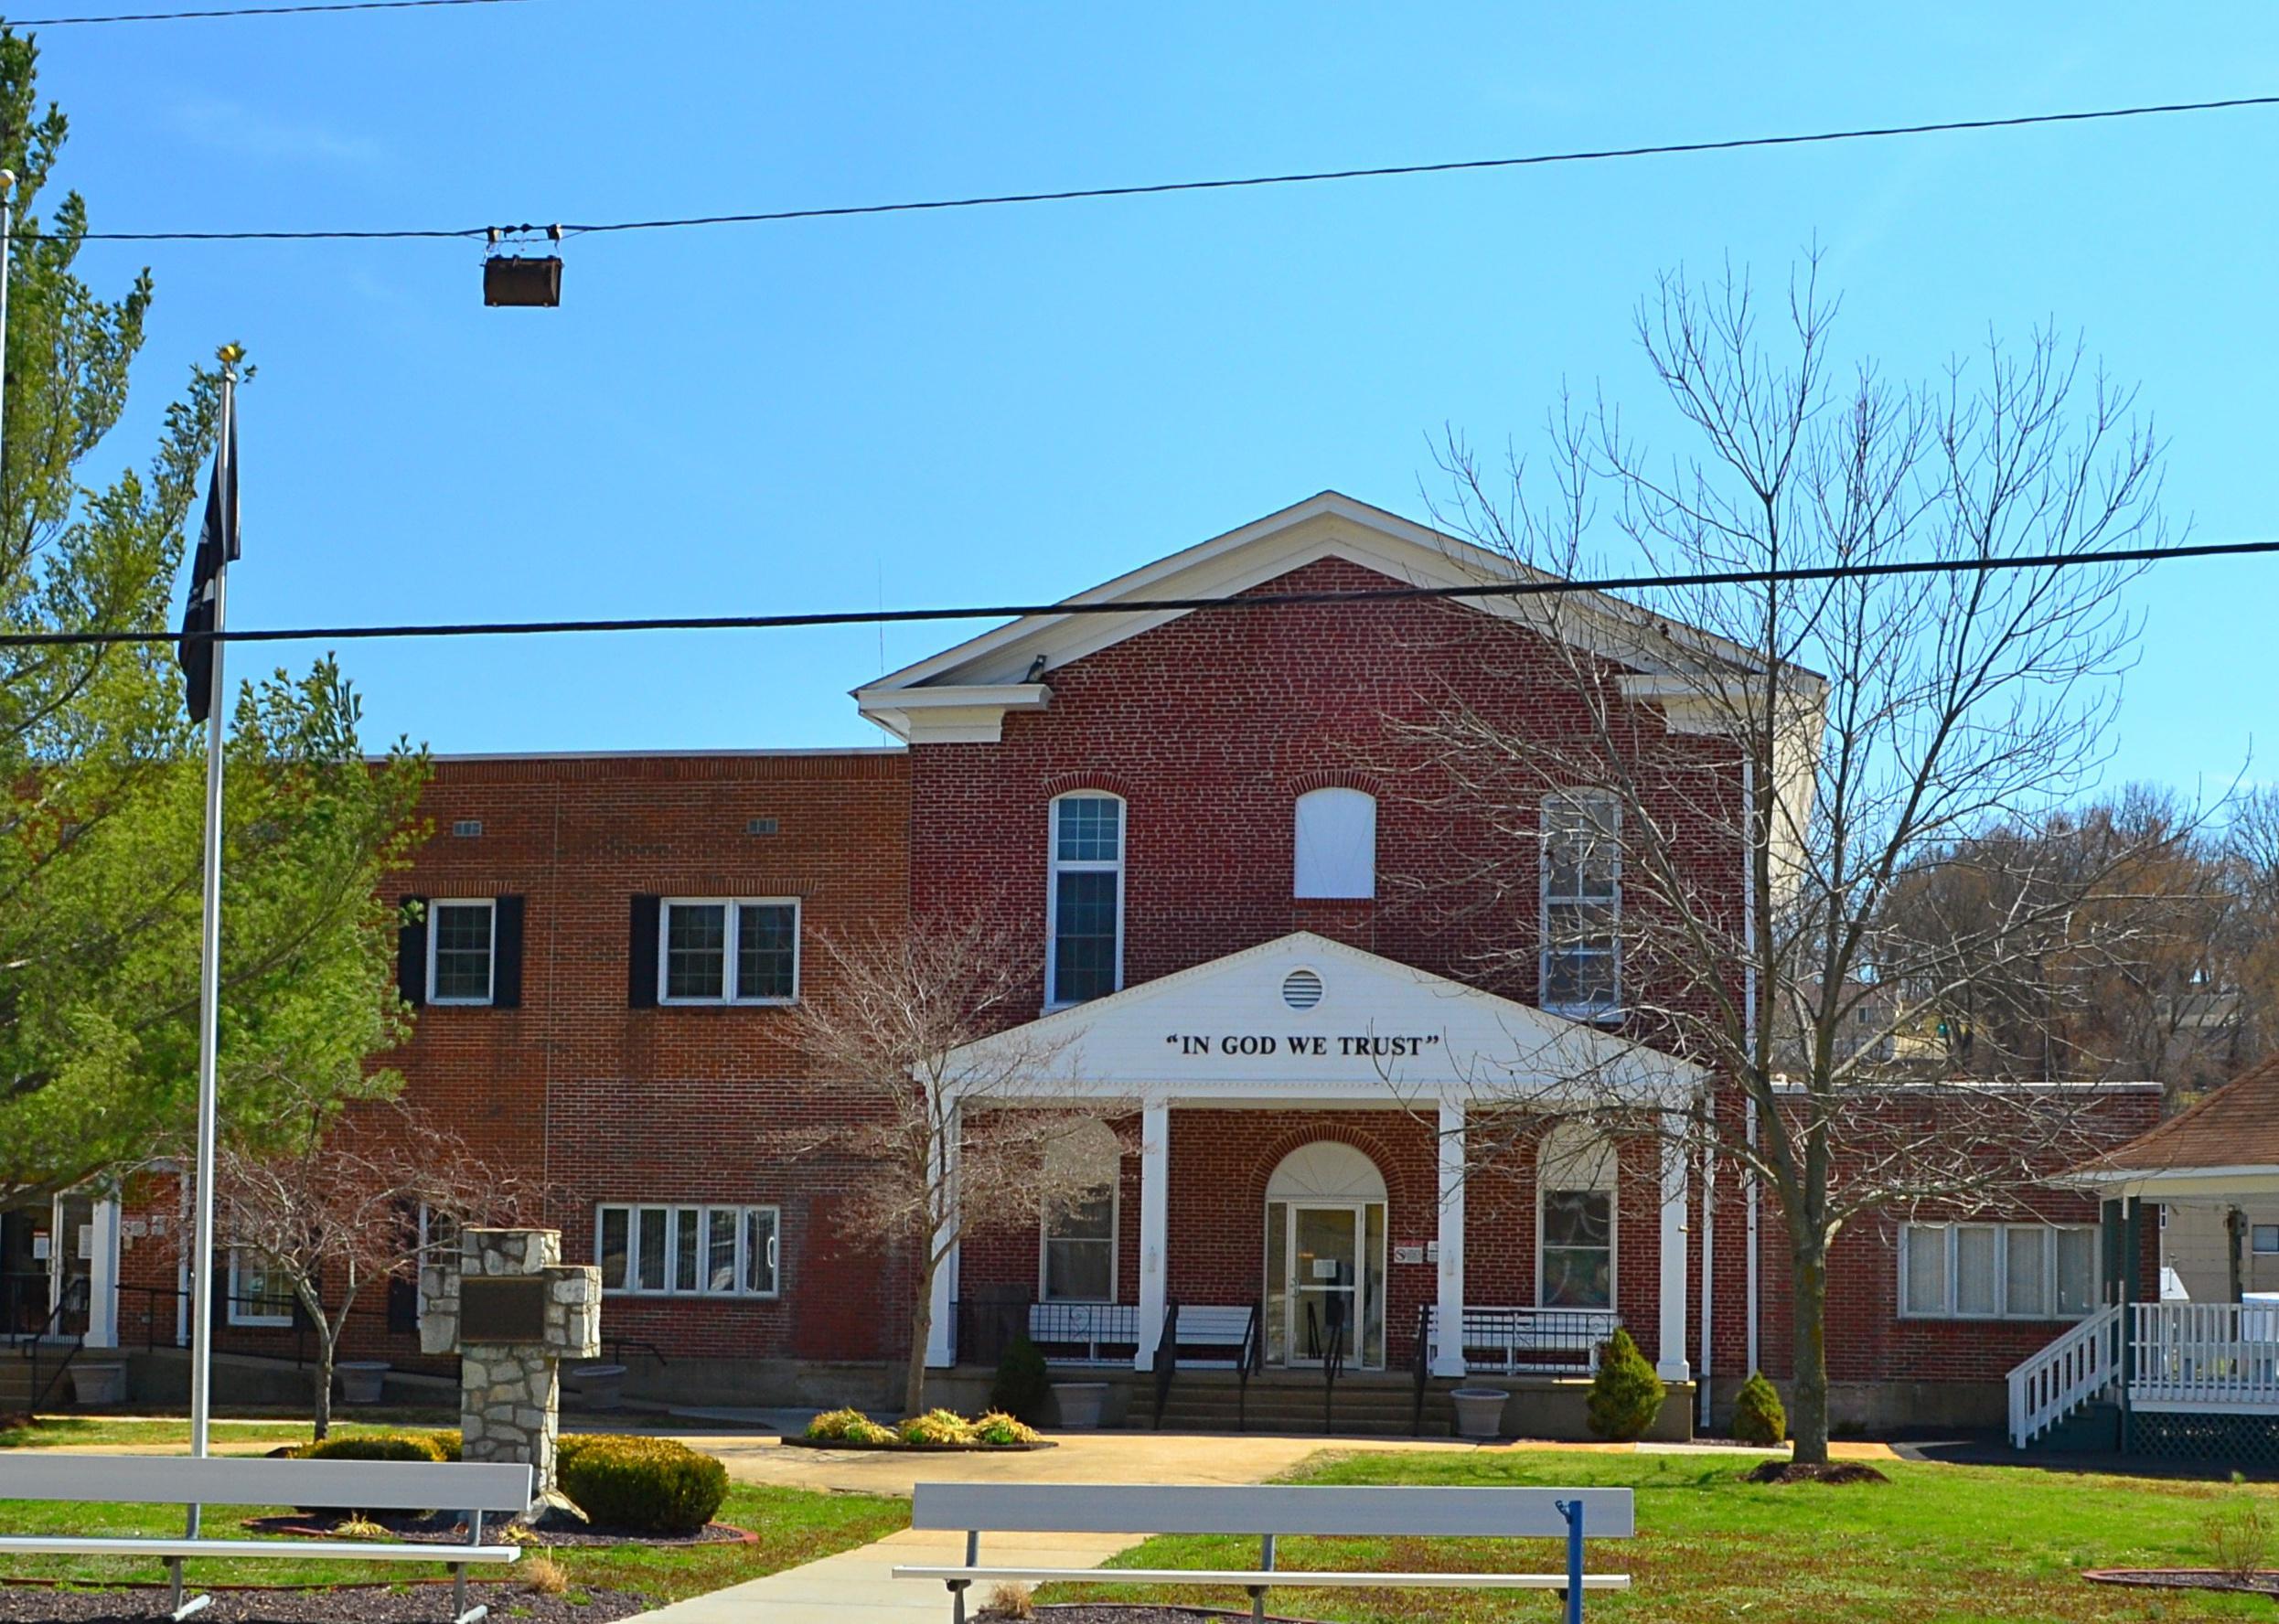
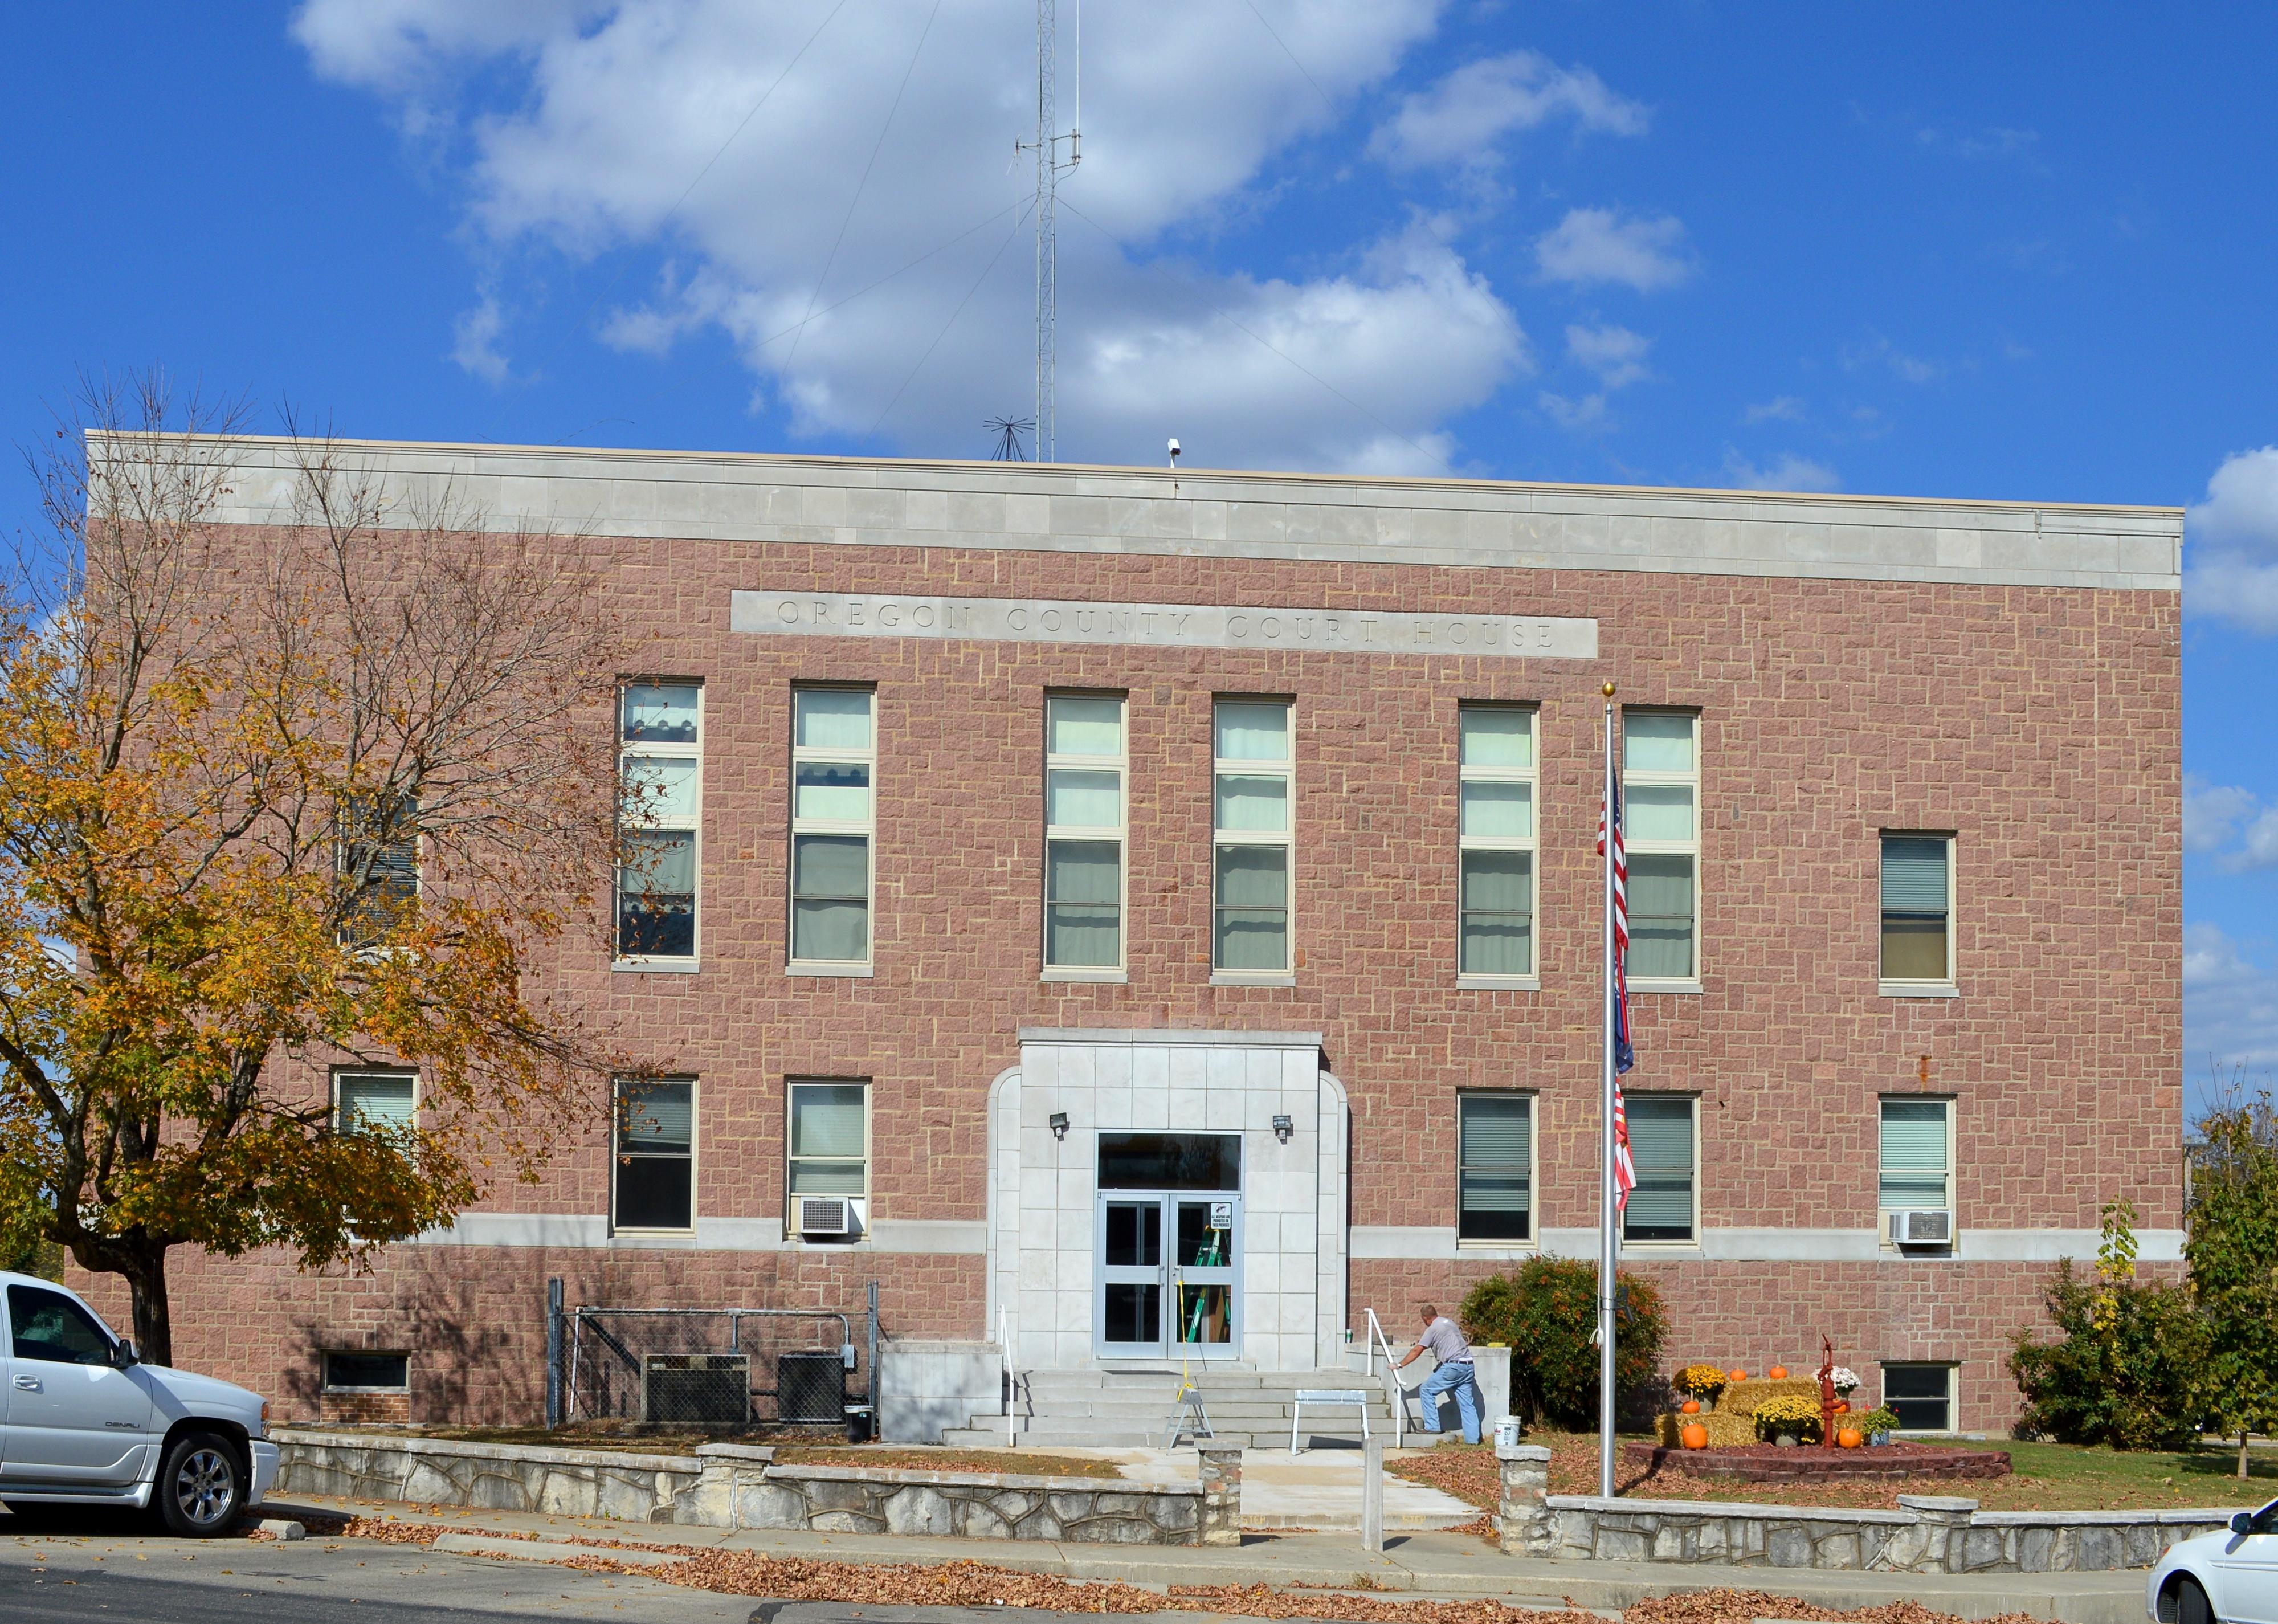
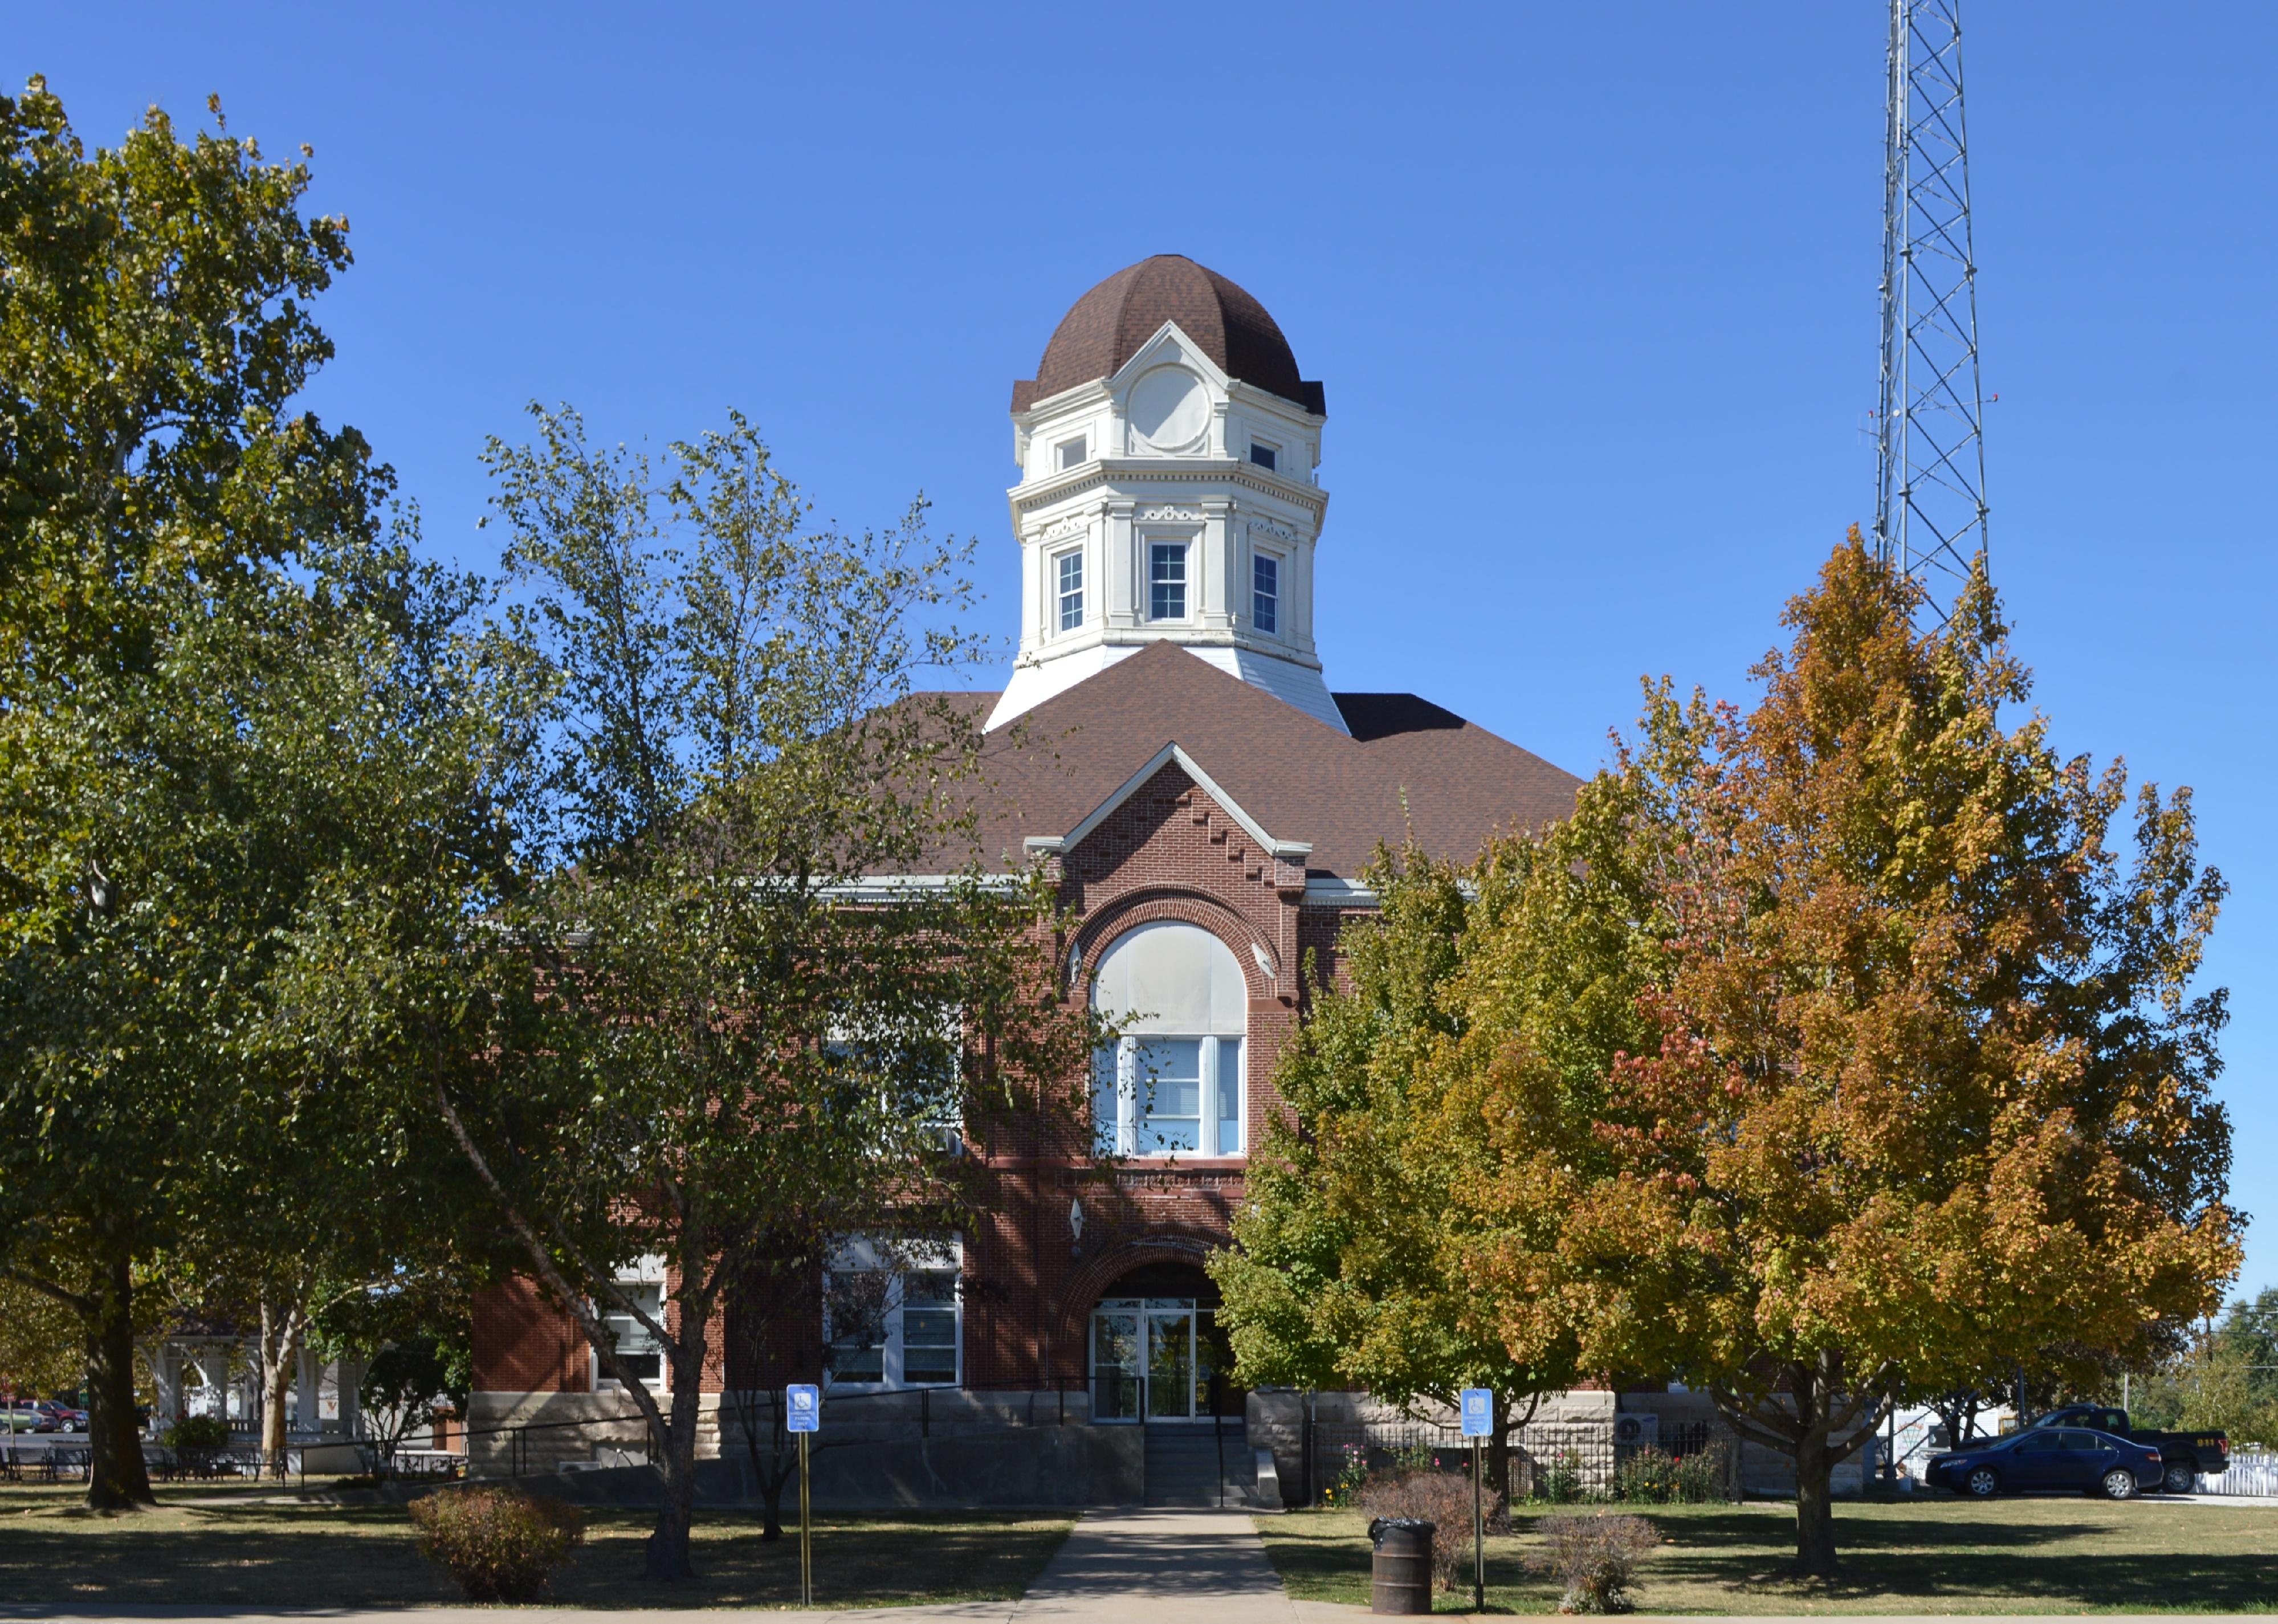
#21. Oregon County
– Emergency shelters per 100K people: 101.2 (9 shelters in database)
– Emergency shelter capacity per 100K: 18,886,368 people (1,679,187 total capacity)
– Shelters with generators: 0
– Shelters in 100-year floodplain: 0
Canva
#20. Knox County
– Emergency shelters per 100K people: 105.8 (4 shelters in database)
– Emergency shelter capacity per 100K: 36,721,999 people (1,388,826 total capacity)
– Shelters with generators: 0
– Shelters in 100-year floodplain: 0

Americasroof // Wikimedia Commons
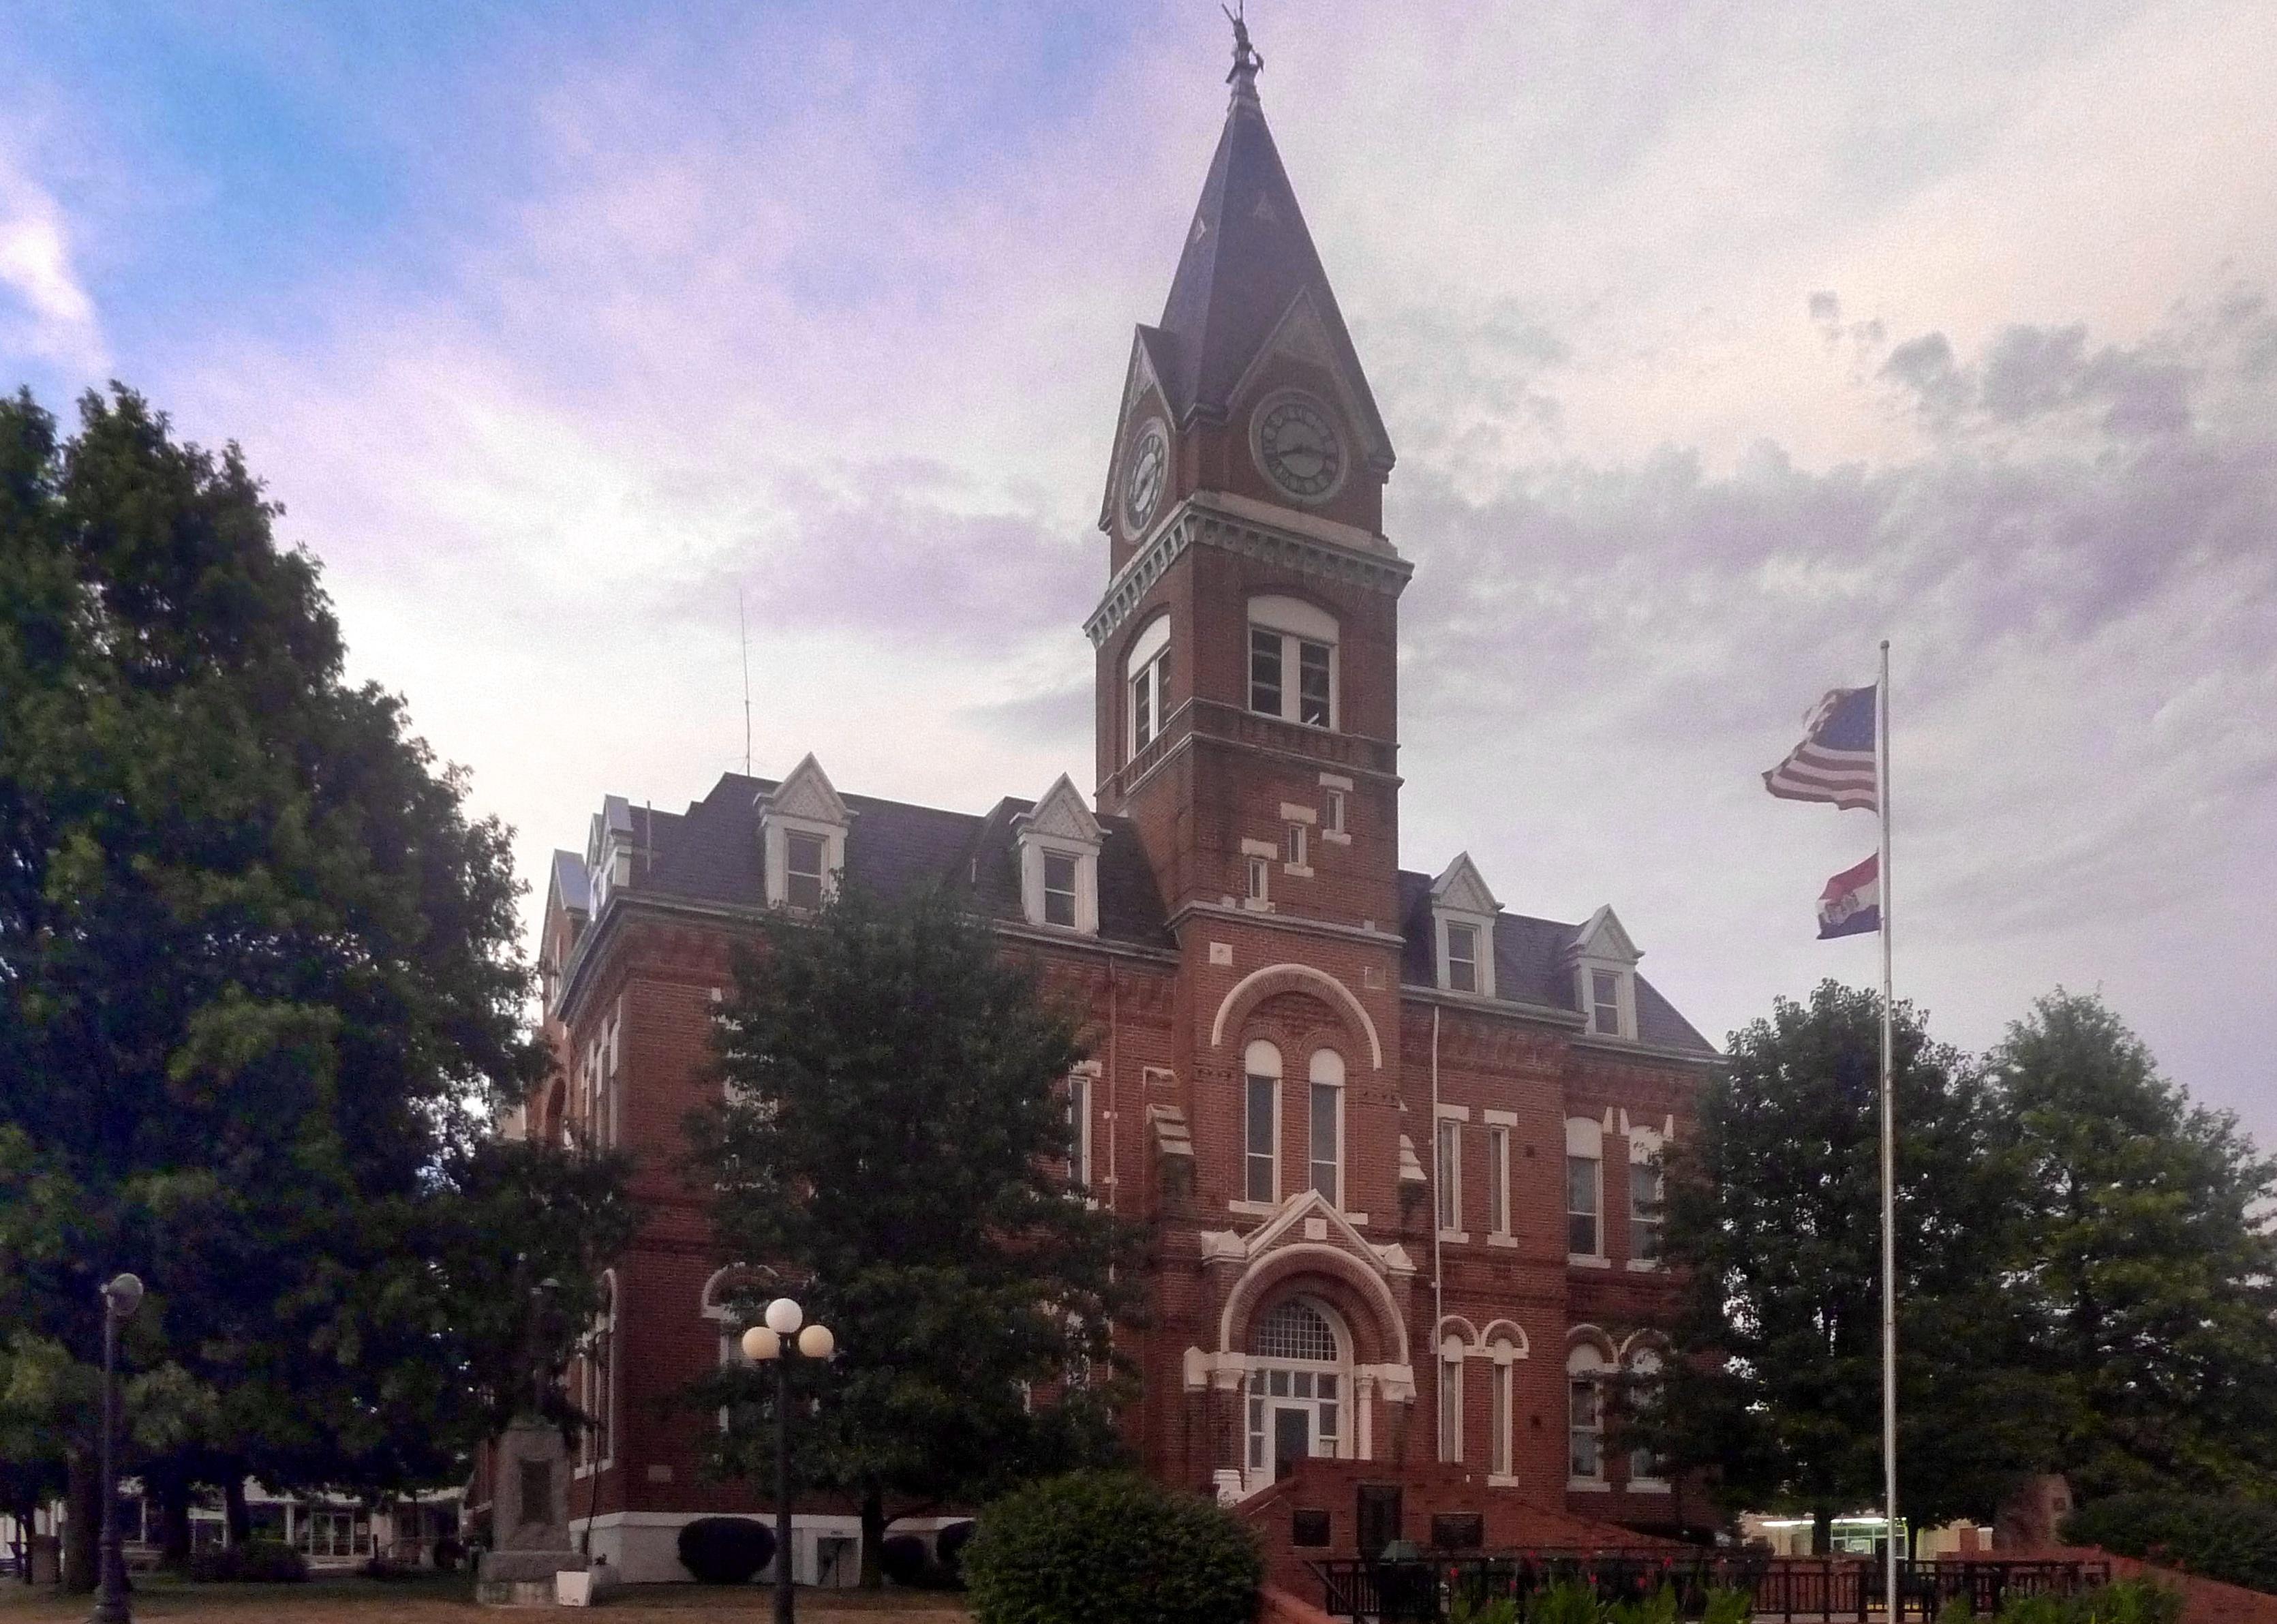
#19. Harrison County
– Emergency shelters per 100K people: 109.4 (9 shelters in database)
– Emergency shelter capacity per 100K: 11,517,827 people (947,802 total capacity)
– Shelters with generators: 1
– Shelters in 100-year floodplain: 0
Nyttend // Wikimedia Commons
#18. Lewis County
– Emergency shelters per 100K people: 109.7 (11 shelters in database)
– Emergency shelter capacity per 100K: 27,855,468 people (2,794,182 total capacity)
– Shelters with generators: 0
– Shelters in 100-year floodplain: 1

Kbh3rd // Wikimedia Commons
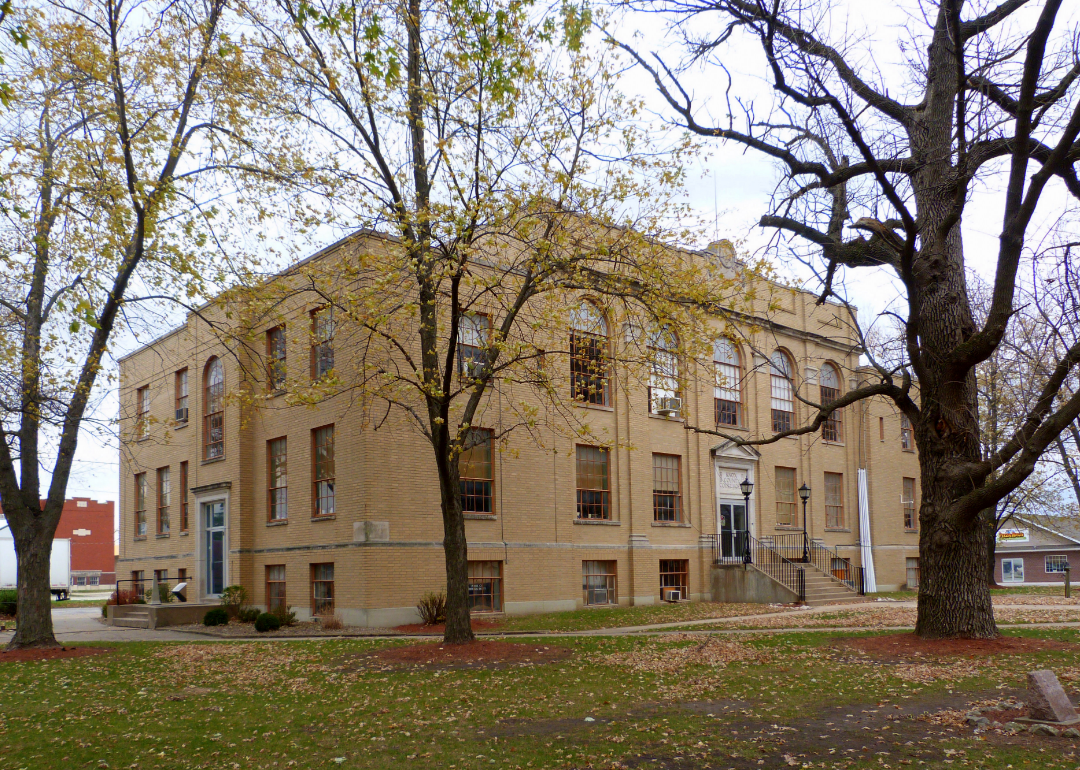
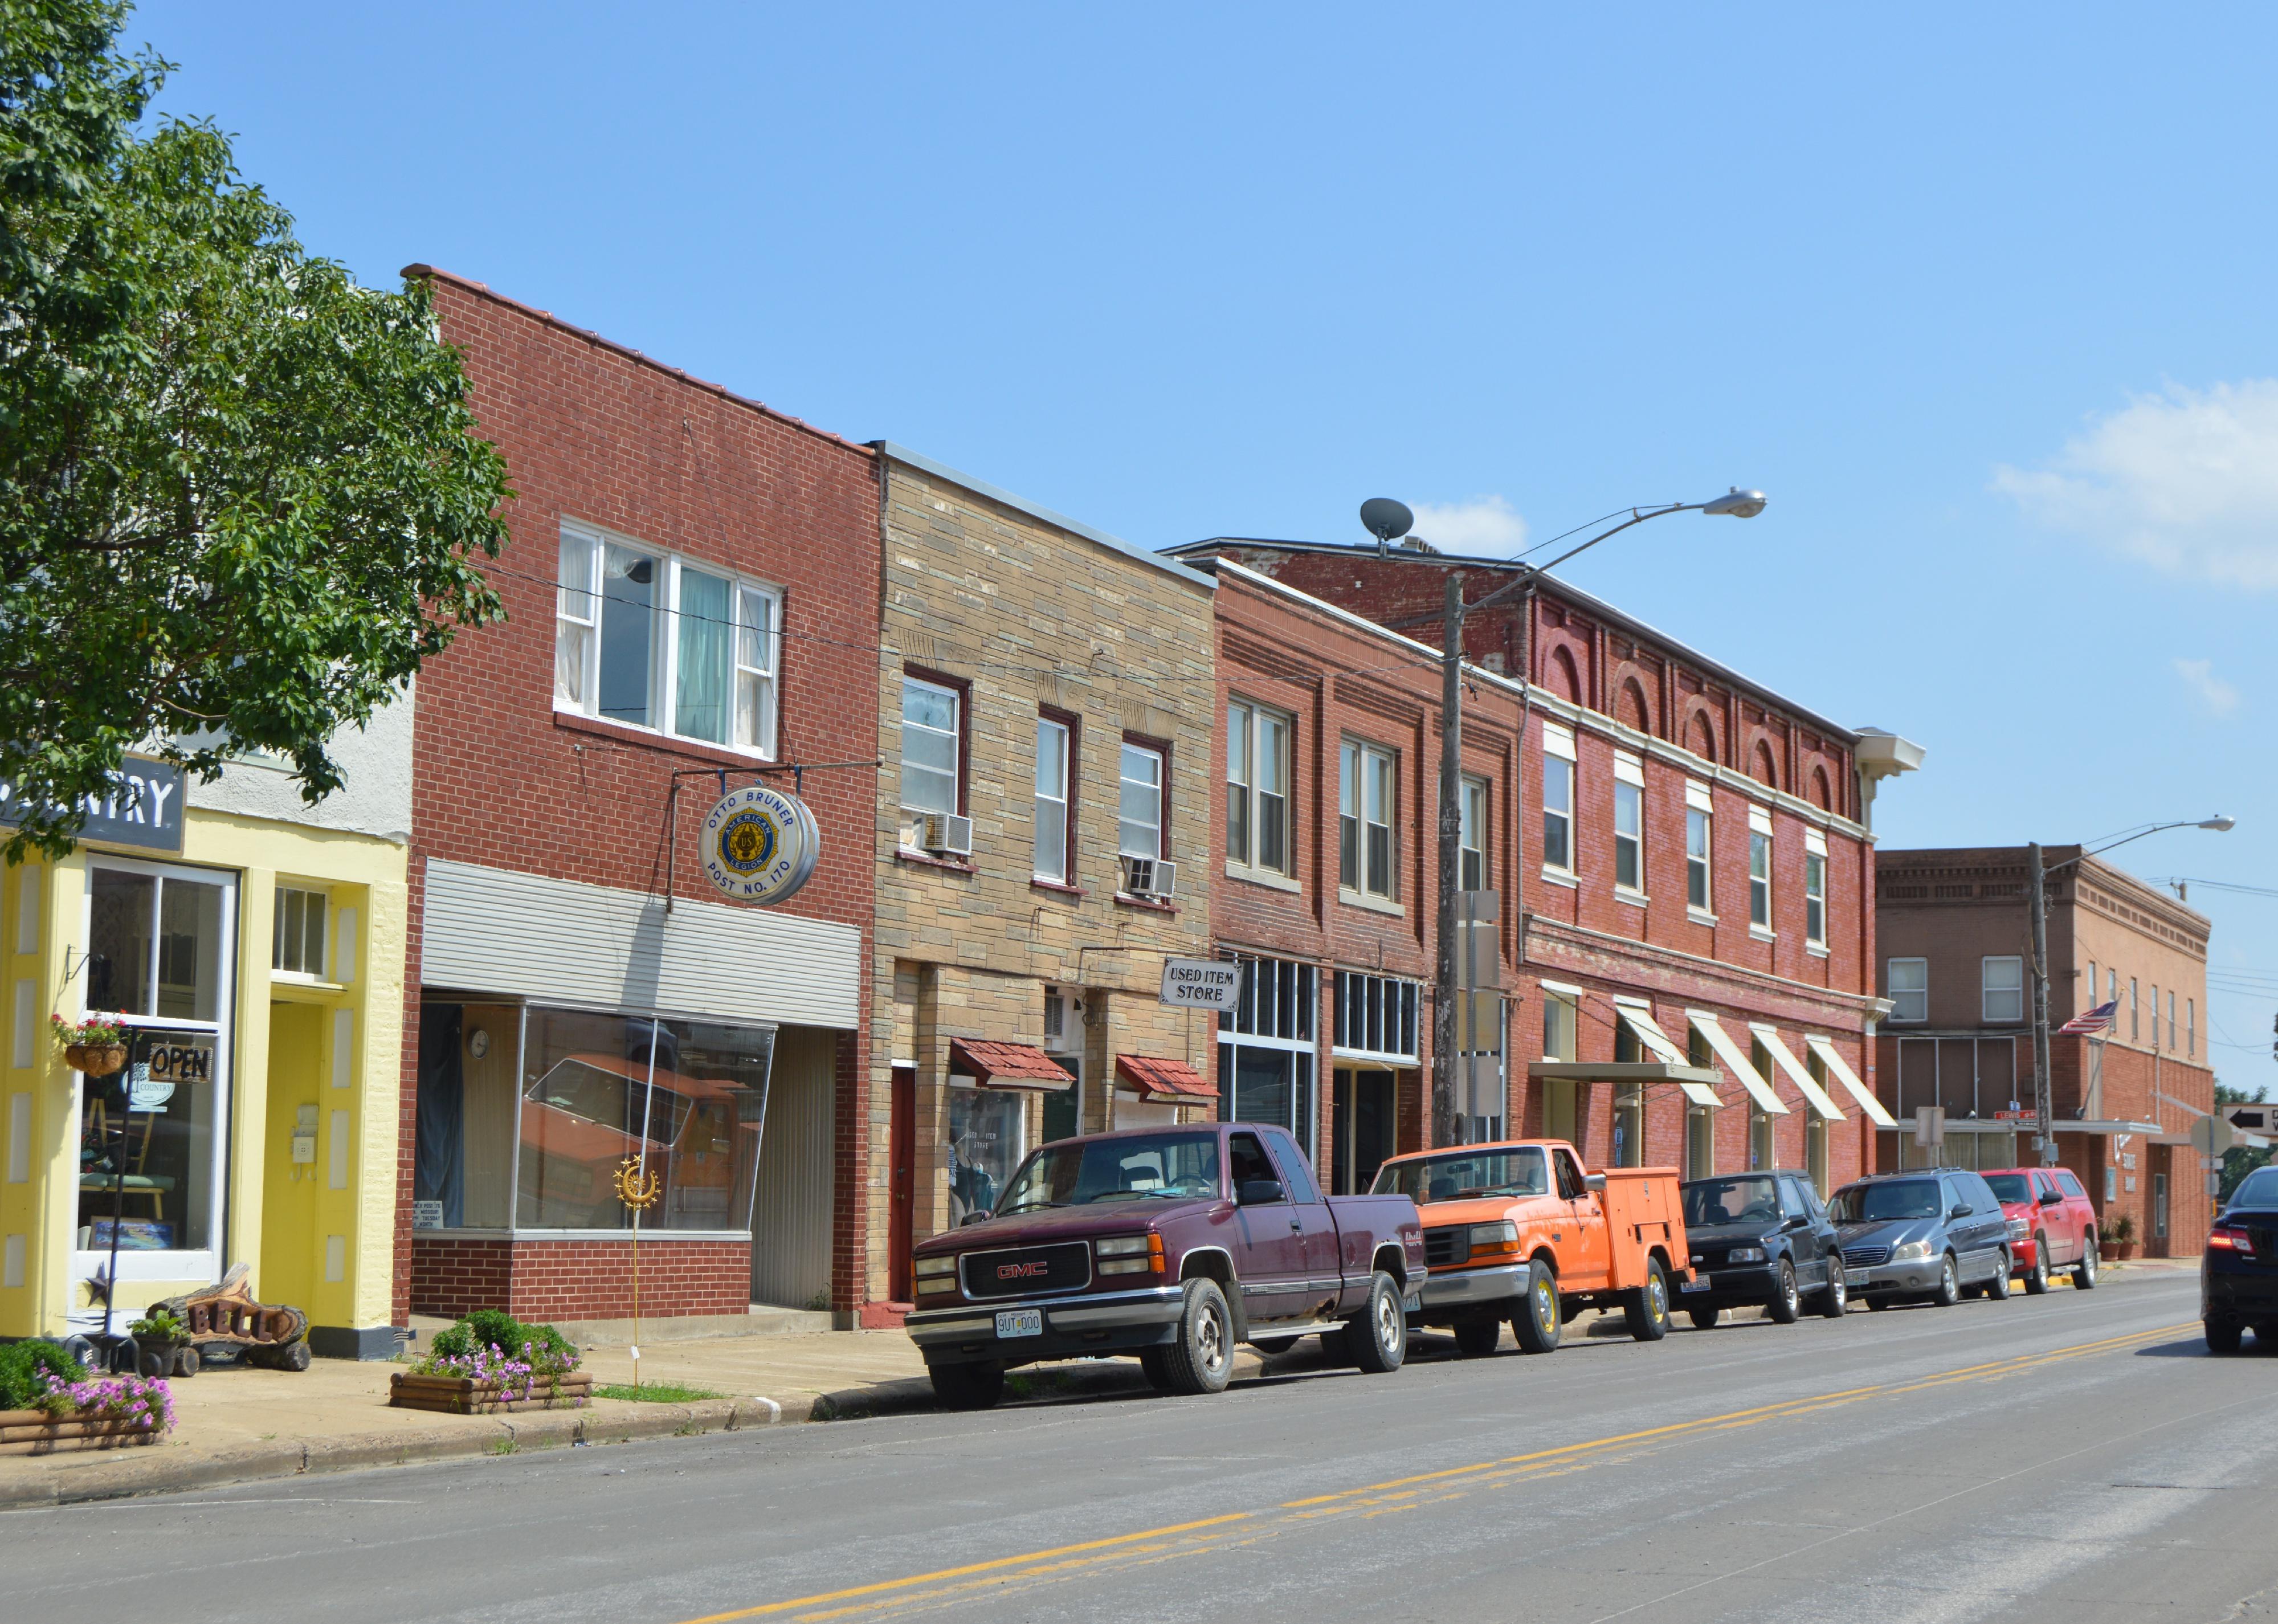
#17. Maries County
– Emergency shelters per 100K people: 118.2 (10 shelters in database)
– Emergency shelter capacity per 100K: 23,190,375 people (1,961,210 total capacity)
– Shelters with generators: 0
– Shelters in 100-year floodplain: 0
Kbh3rd // Wikimedia Commons
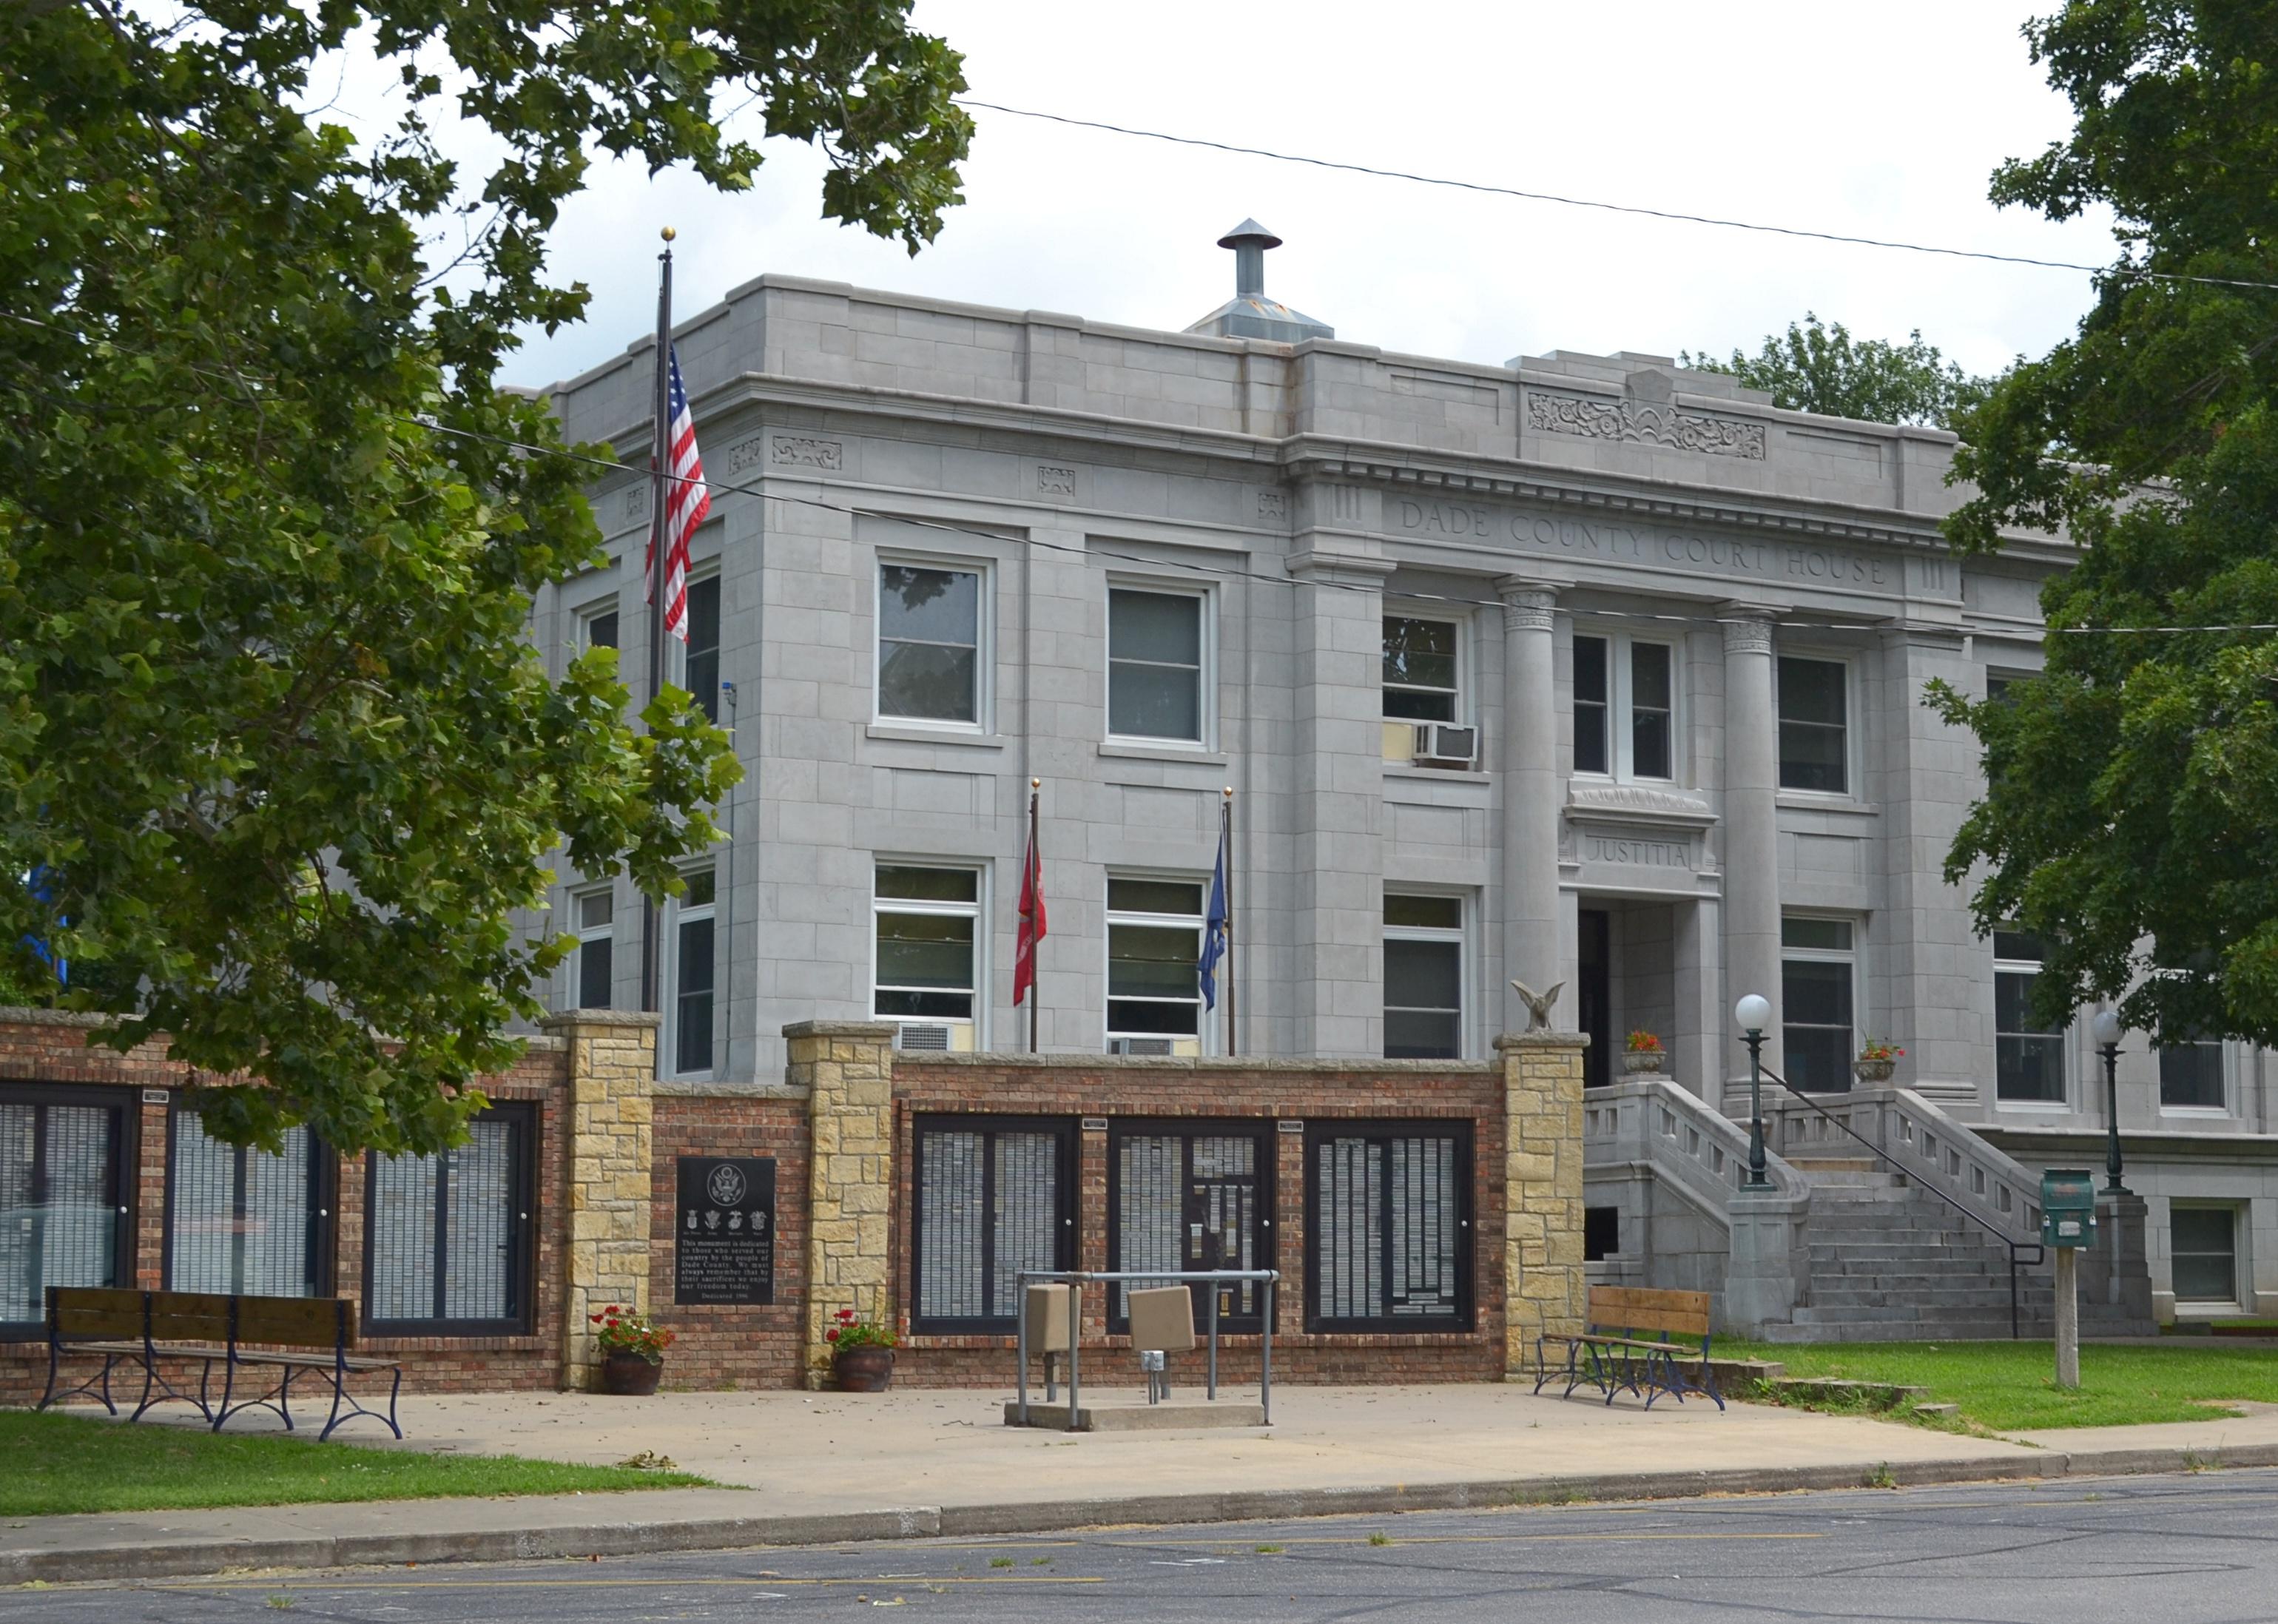
#16. Dade County
– Emergency shelters per 100K people: 118.7 (9 shelters in database)
– Emergency shelter capacity per 100K: 15,268,539 people (1,157,966 total capacity)
– Shelters with generators: 0
– Shelters in 100-year floodplain: 0
Kbh3rd // Wikimedia Commons
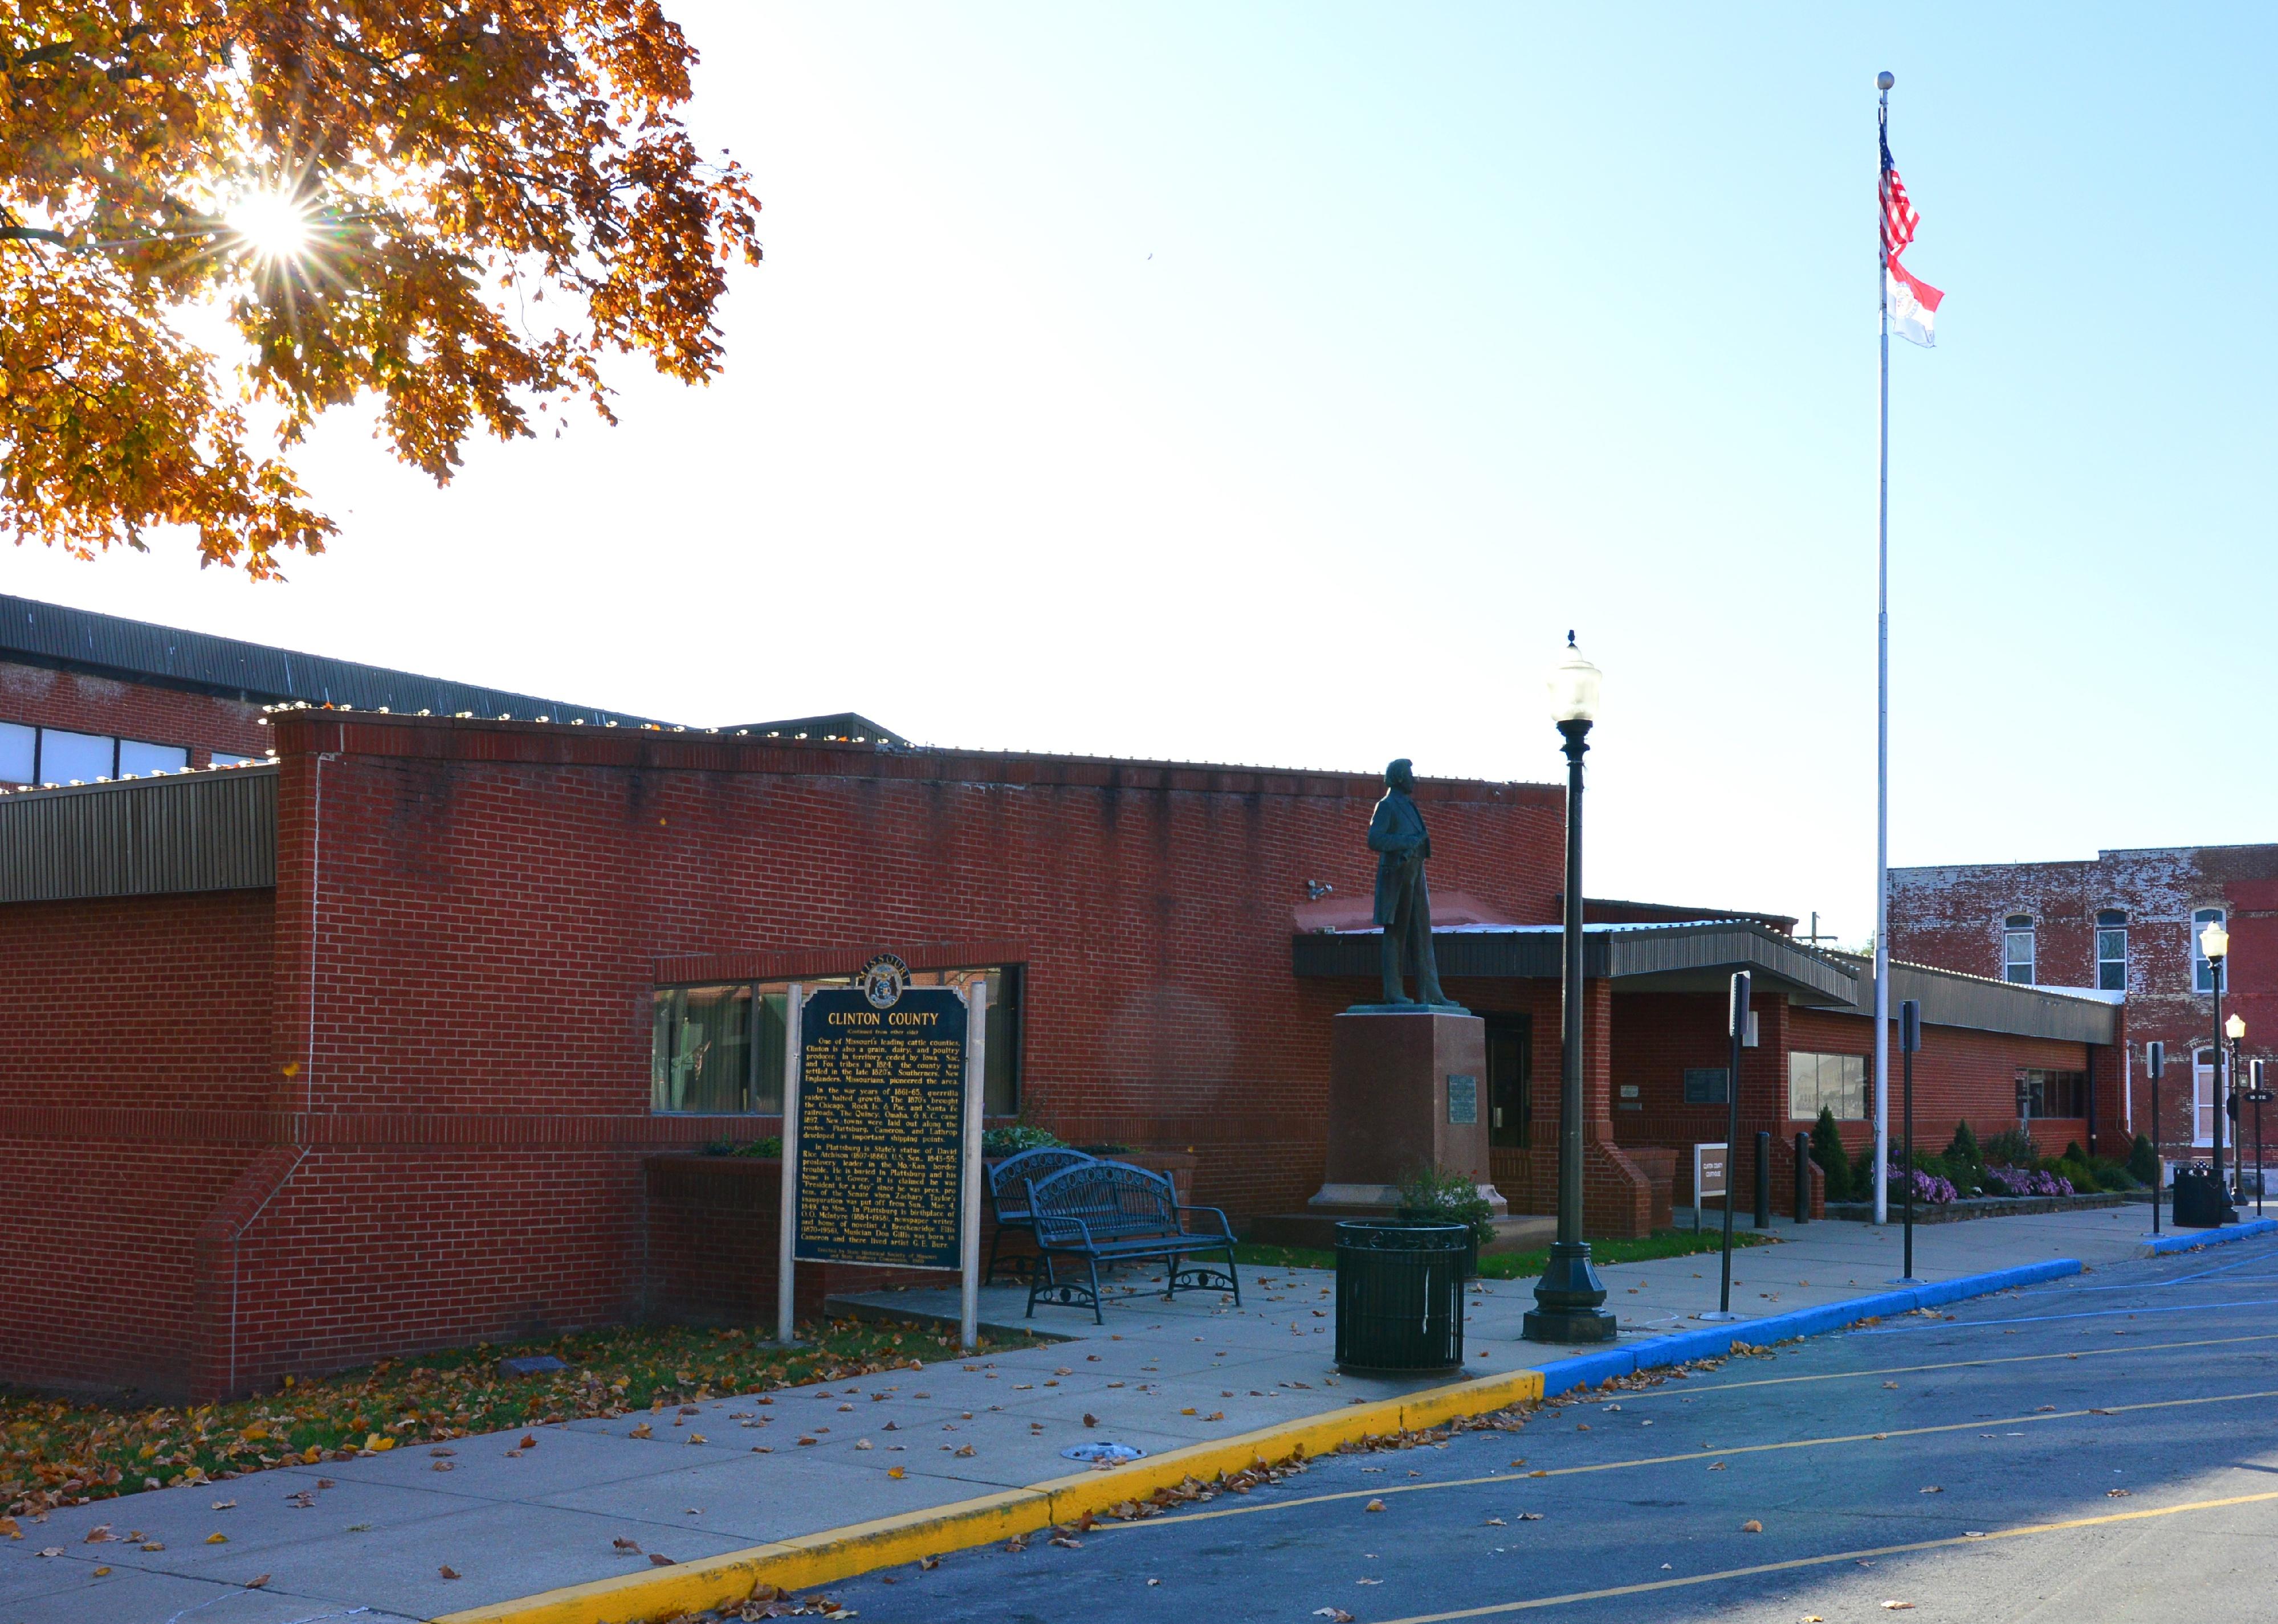
#15. Clinton County
– Emergency shelters per 100K people: 123.3 (26 shelters in database)
– Emergency shelter capacity per 100K: 13,943,015 people (2,941,279 total capacity)
– Shelters with generators: 0
– Shelters in 100-year floodplain: 0

Joseph Sohm // Shutterstock
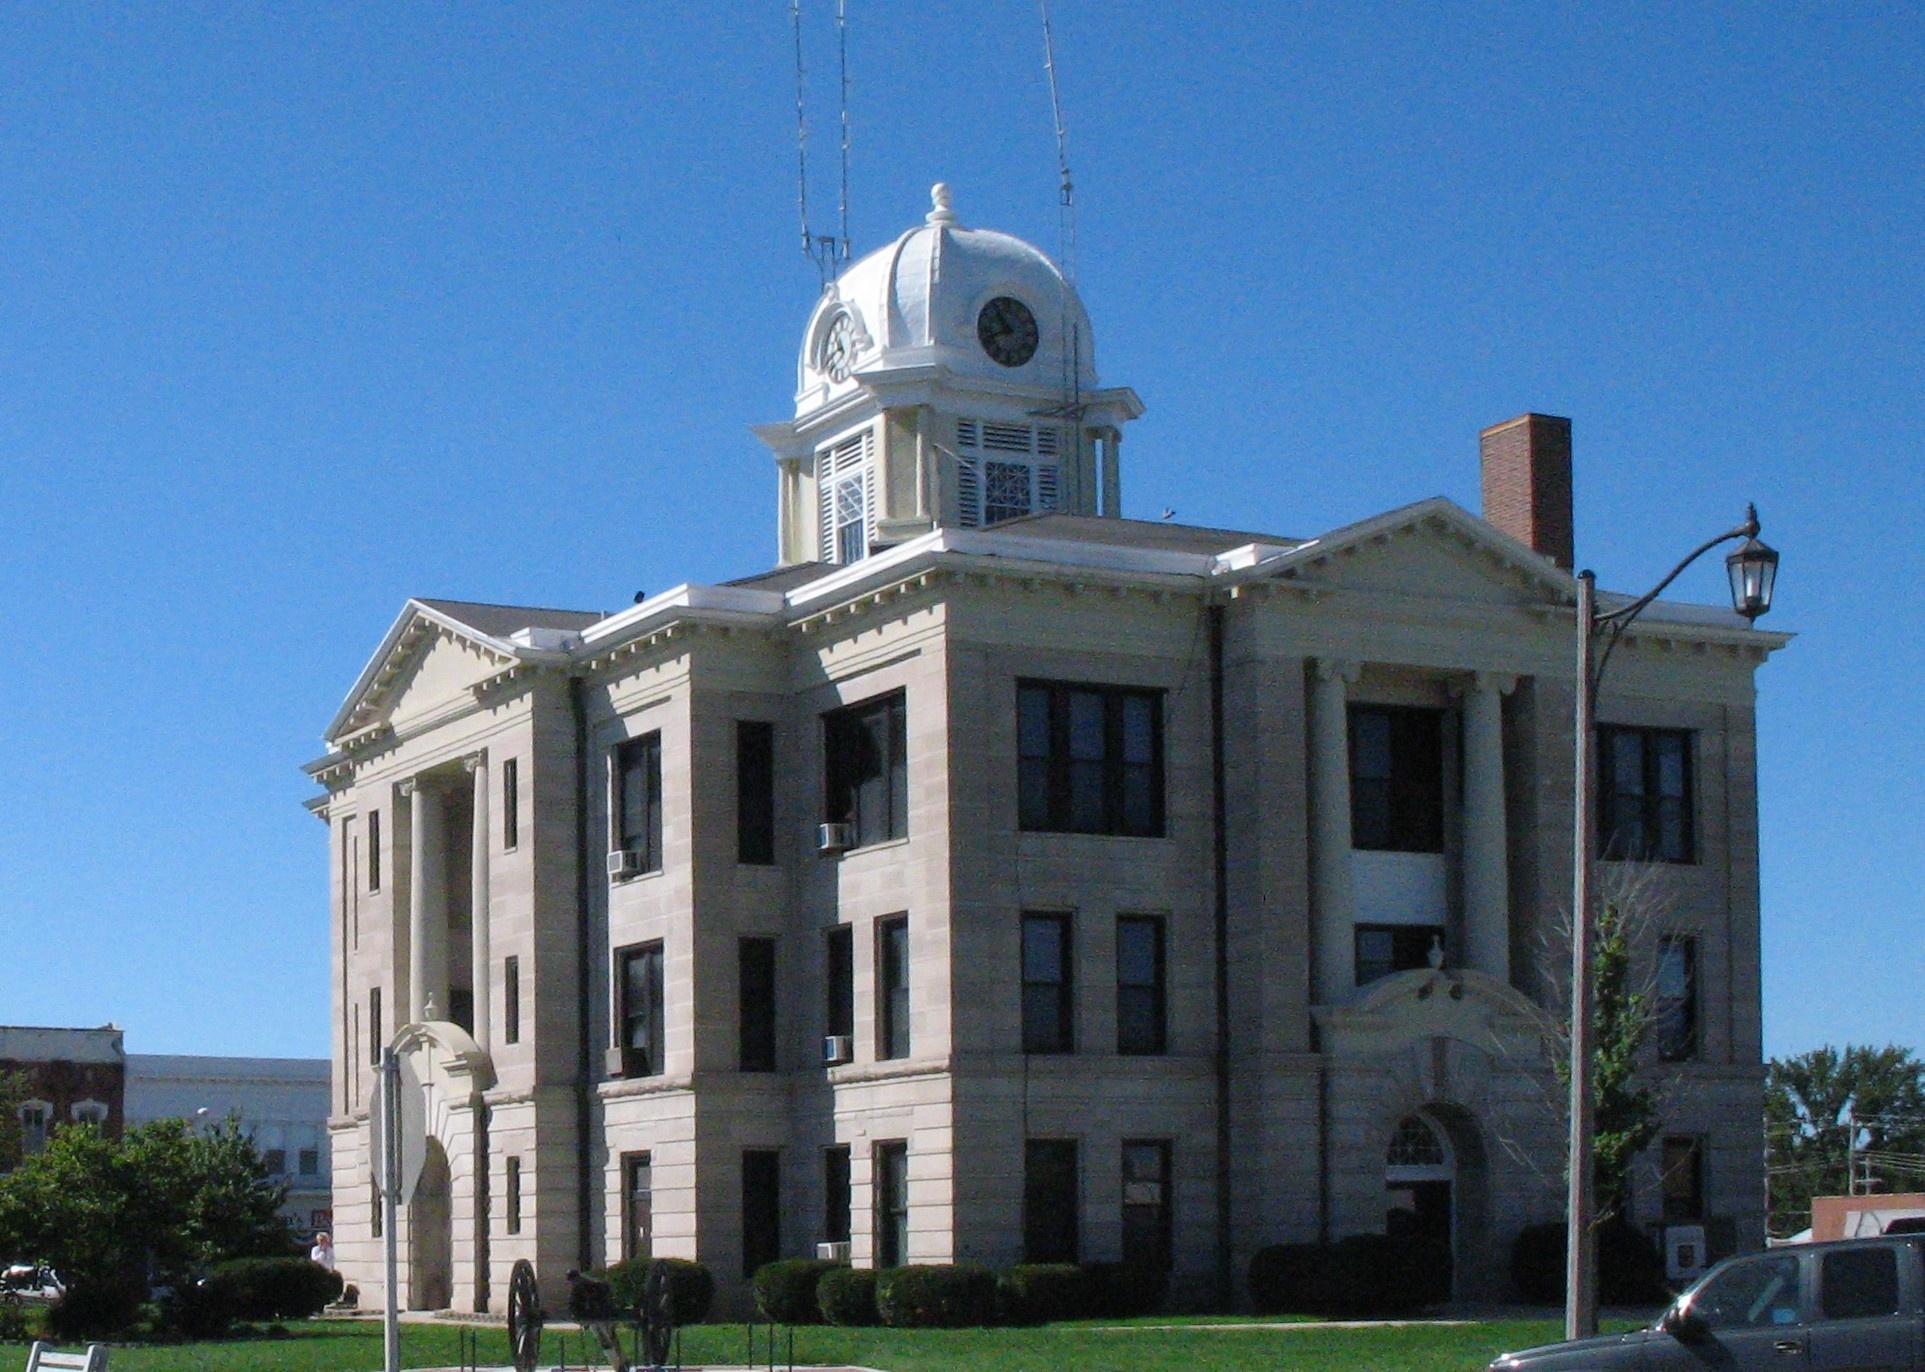
#14. New Madrid County
– Emergency shelters per 100K people: 126.1 (21 shelters in database)
– Emergency shelter capacity per 100K: 27,195,678 people (4,530,256 total capacity)
– Shelters with generators: 0
– Shelters in 100-year floodplain: 0
en:User:Americasroof // Wikimedia Commons
#13. Daviess County
– Emergency shelters per 100K people: 130.5 (11 shelters in database)
– Emergency shelter capacity per 100K: 28,289,546 people (2,383,960 total capacity)
– Shelters with generators: 0
– Shelters in 100-year floodplain: 0
Kbh3rd // Wikimedia Commons
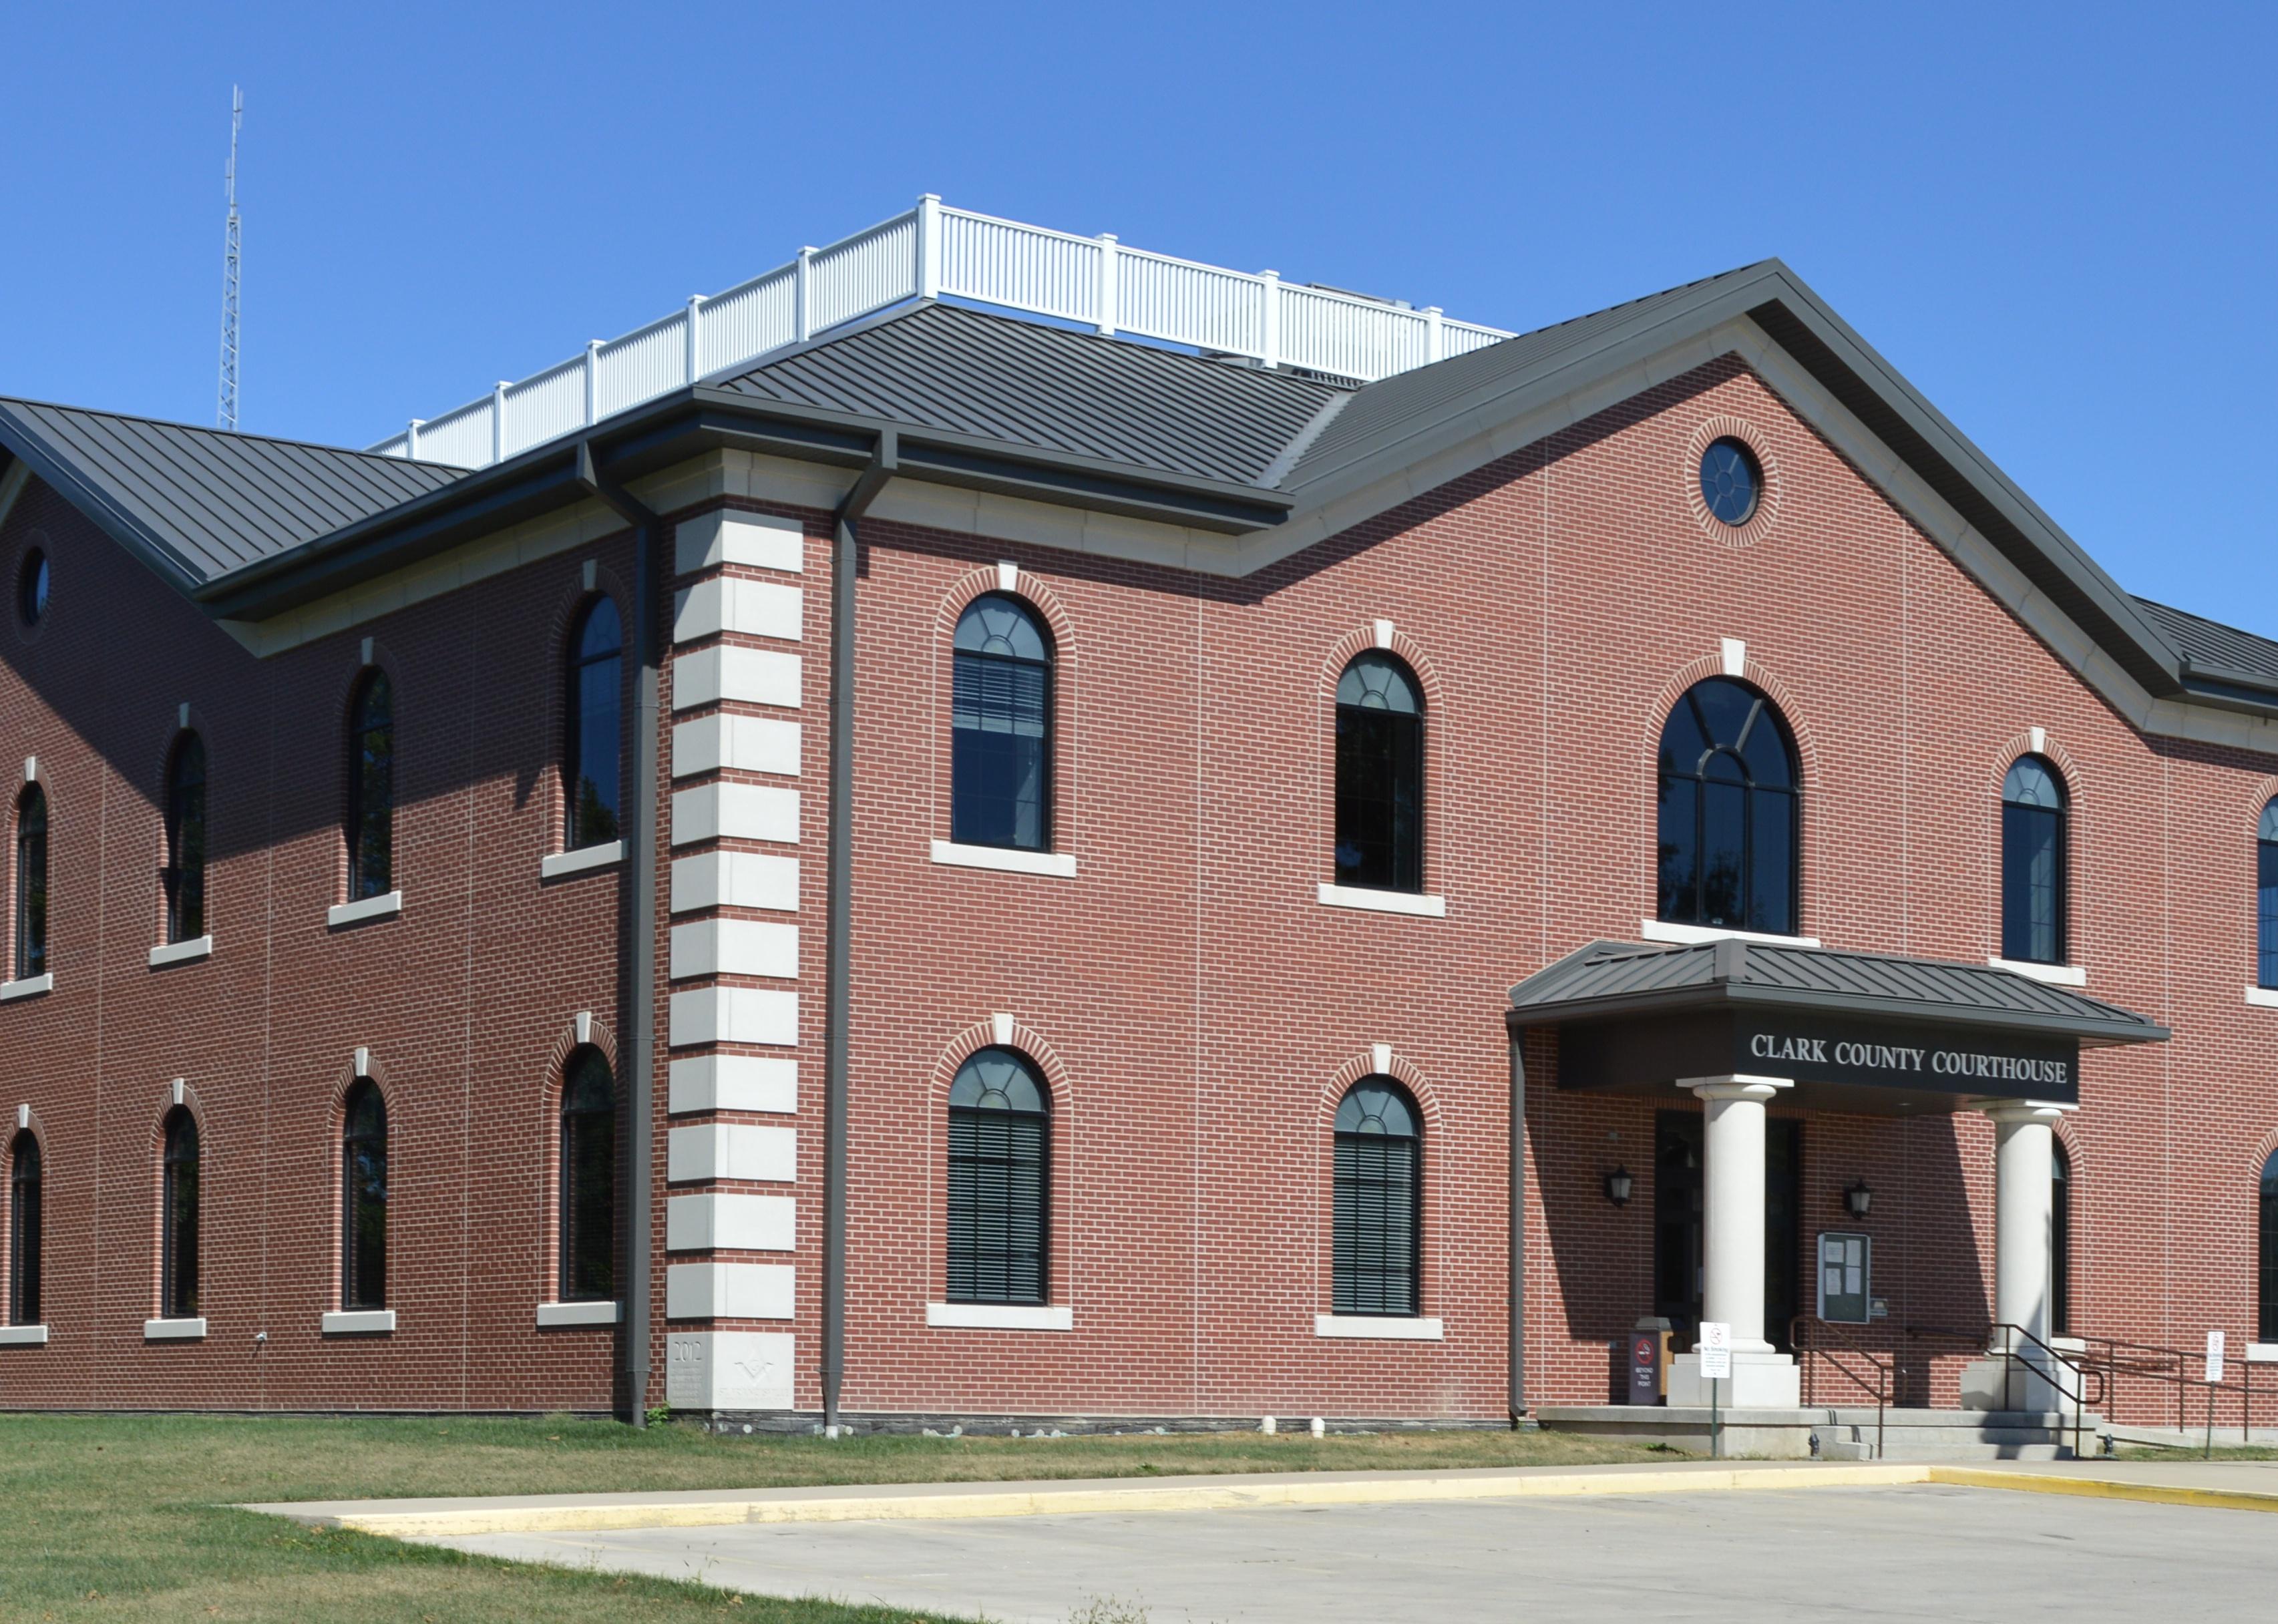
#12. Clark County
– Emergency shelters per 100K people: 135.4 (9 shelters in database)
– Emergency shelter capacity per 100K: 41,756,039 people (2,776,359 total capacity)
– Shelters with generators: 0
– Shelters in 100-year floodplain: 0

NMSU // Wikimedia Commons
#11. Nodaway County
– Emergency shelters per 100K people: 139.1 (30 shelters in database)
– Emergency shelter capacity per 100K: 17,590,761 people (3,794,503 total capacity)
– Shelters with generators: 2
– Shelters in 100-year floodplain: 0
Kbh3rd // Wikimedia Commons
#10. Mercer County
– Emergency shelters per 100K people: 140.4 (5 shelters in database)
– Emergency shelter capacity per 100K: 20,957,484 people (746,296 total capacity)
– Shelters with generators: 0
– Shelters in 100-year floodplain: 0
Brian Stansberry // Wikimedia Commons
#9. Stoddard County
– Emergency shelters per 100K people: 159.7 (46 shelters in database)
– Emergency shelter capacity per 100K: 23,772,980 people (6,849,471 total capacity)
– Shelters with generators: 1
– Shelters in 100-year floodplain: 1
David Wilson // Wikimedia Commons
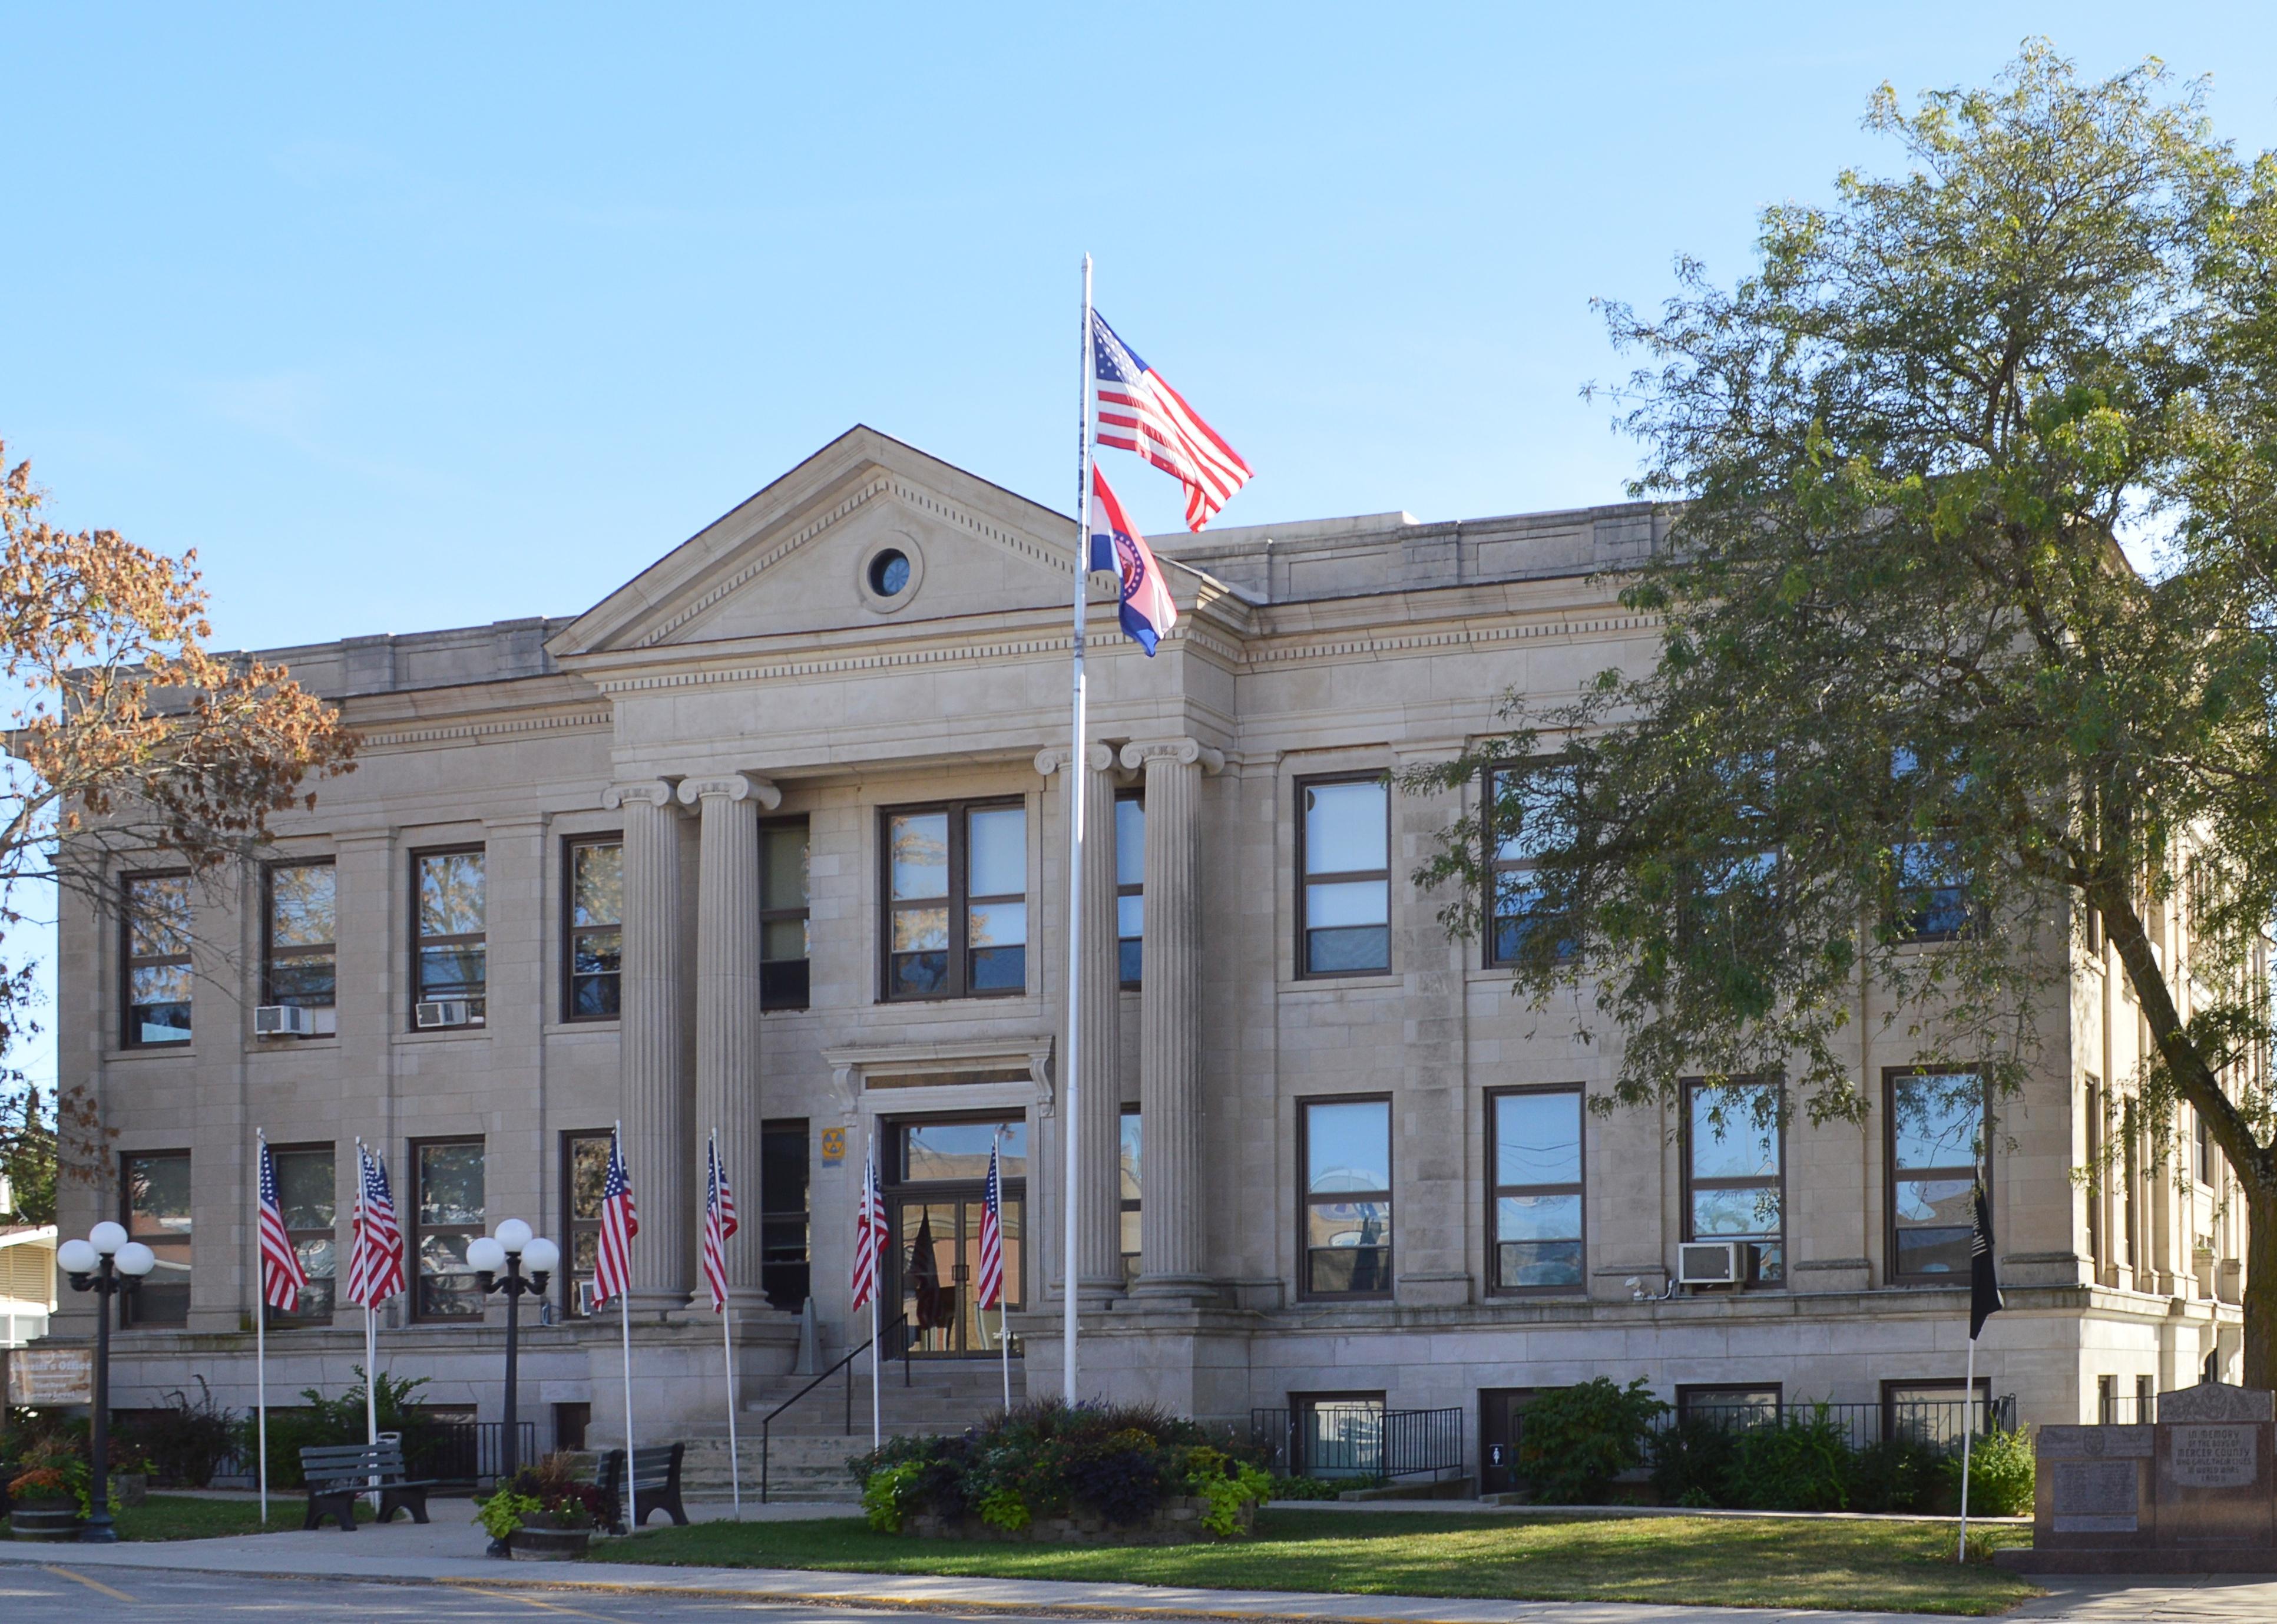
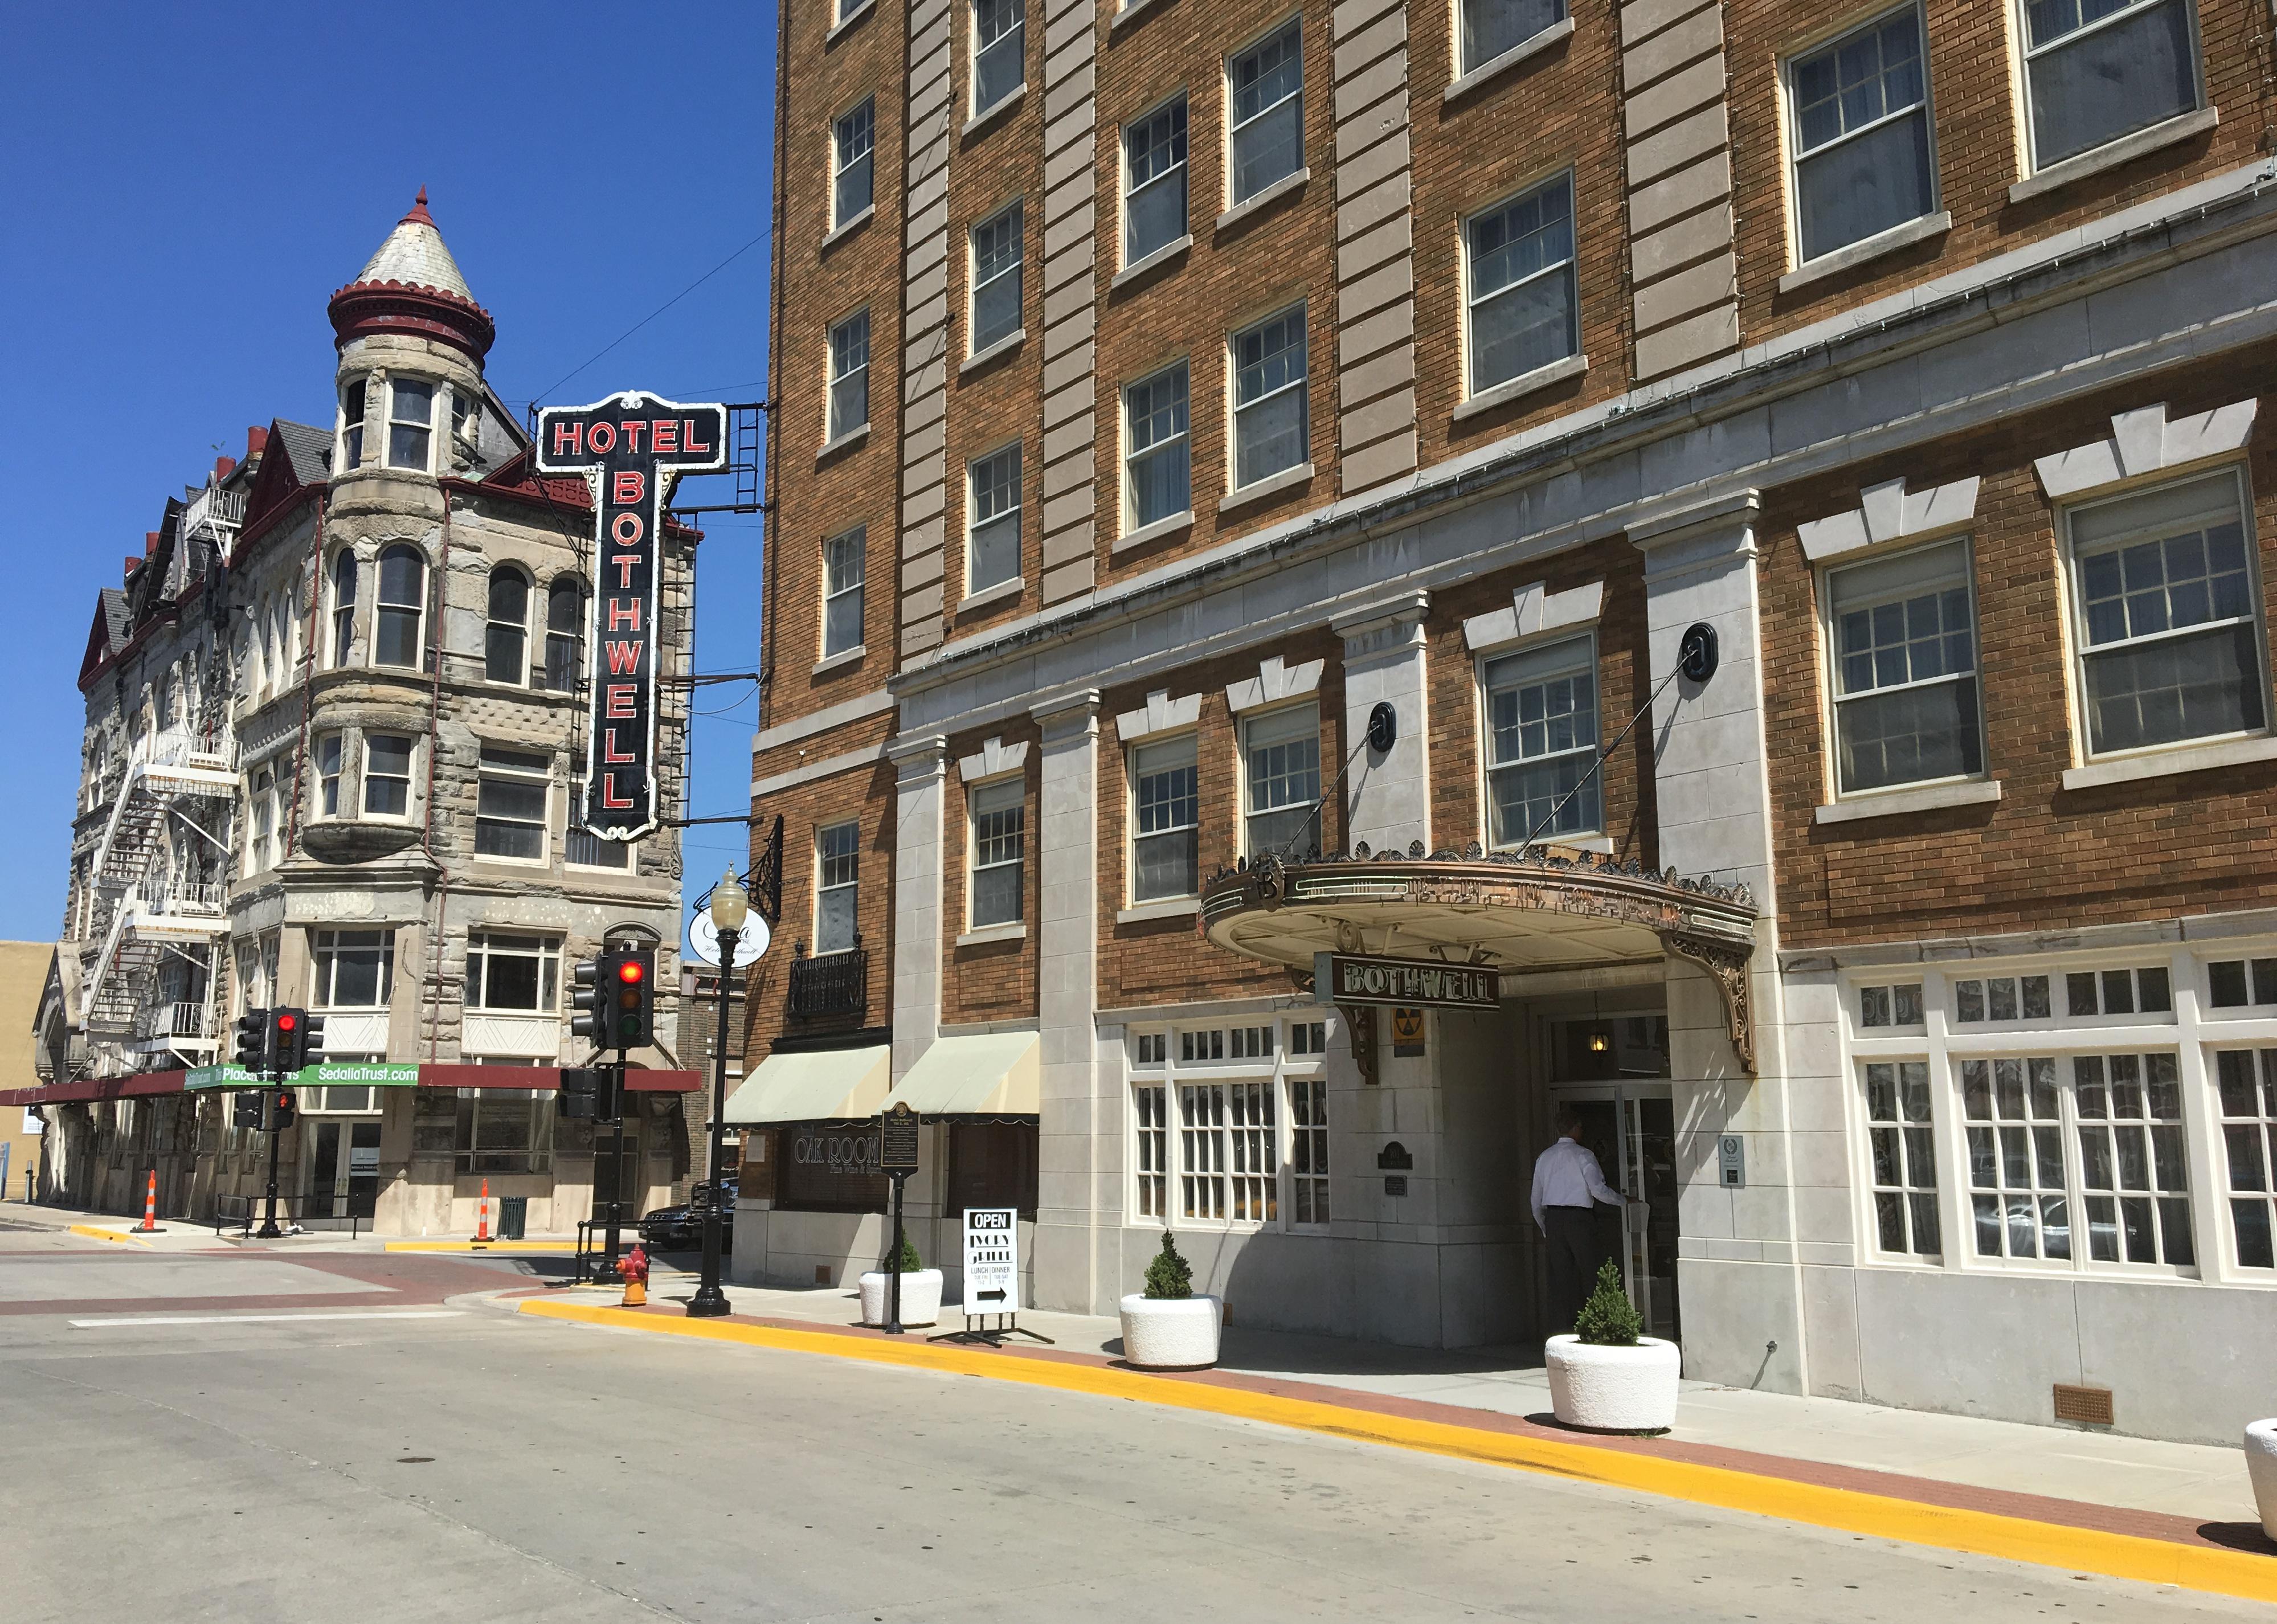
#8. Pettis County
– Emergency shelters per 100K people: 160.8 (69 shelters in database)
– Emergency shelter capacity per 100K: 18,251,455 people (7,833,342 total capacity)
– Shelters with generators: 0
– Shelters in 100-year floodplain: 0
Kbh3rd // Wikimedia Commons
#7. Shelby County
– Emergency shelters per 100K people: 164.3 (10 shelters in database)
– Emergency shelter capacity per 100K: 55,164,777 people (3,357,880 total capacity)
– Shelters with generators: 0
– Shelters in 100-year floodplain: 0

Patrick Jennings // Shutterstock
#6. Osage County
– Emergency shelters per 100K people: 164.5 (22 shelters in database)
– Emergency shelter capacity per 100K: 27,928,096 people (3,734,545 total capacity)
– Shelters with generators: 1
– Shelters in 100-year floodplain: 0
Charvex // Wikimedia Commons
#5. Sullivan County
– Emergency shelters per 100K people: 165.4 (10 shelters in database)
– Emergency shelter capacity per 100K: 58,296,427 people (3,524,019 total capacity)
– Shelters with generators: 0
– Shelters in 100-year floodplain: 0
Americasroof // Wikimedia Commons
#4. Gentry County
– Emergency shelters per 100K people: 208.6 (13 shelters in database)
– Emergency shelter capacity per 100K: 29,308,377 people (1,826,205 total capacity)
– Shelters with generators: 3
– Shelters in 100-year floodplain: 0

Original by Patrick Hull, modifications by Kbh3rd // Wikimedia Commons
#3. Worth County
– Emergency shelters per 100K people: 249.5 (5 shelters in database)
– Emergency shelter capacity per 100K: 25,838,273 people (517,799 total capacity)
– Shelters with generators: 0
– Shelters in 100-year floodplain: 0

JERRYE AND ROY KLOTZ MD // Wikimedia Commons
#2. Atchison County
– Emergency shelters per 100K people: 282.4 (15 shelters in database)
– Emergency shelter capacity per 100K: 28,948,475 people (1,537,743 total capacity)
– Shelters with generators: 1
– Shelters in 100-year floodplain: 2
Americasroof // Wikimedia Commons
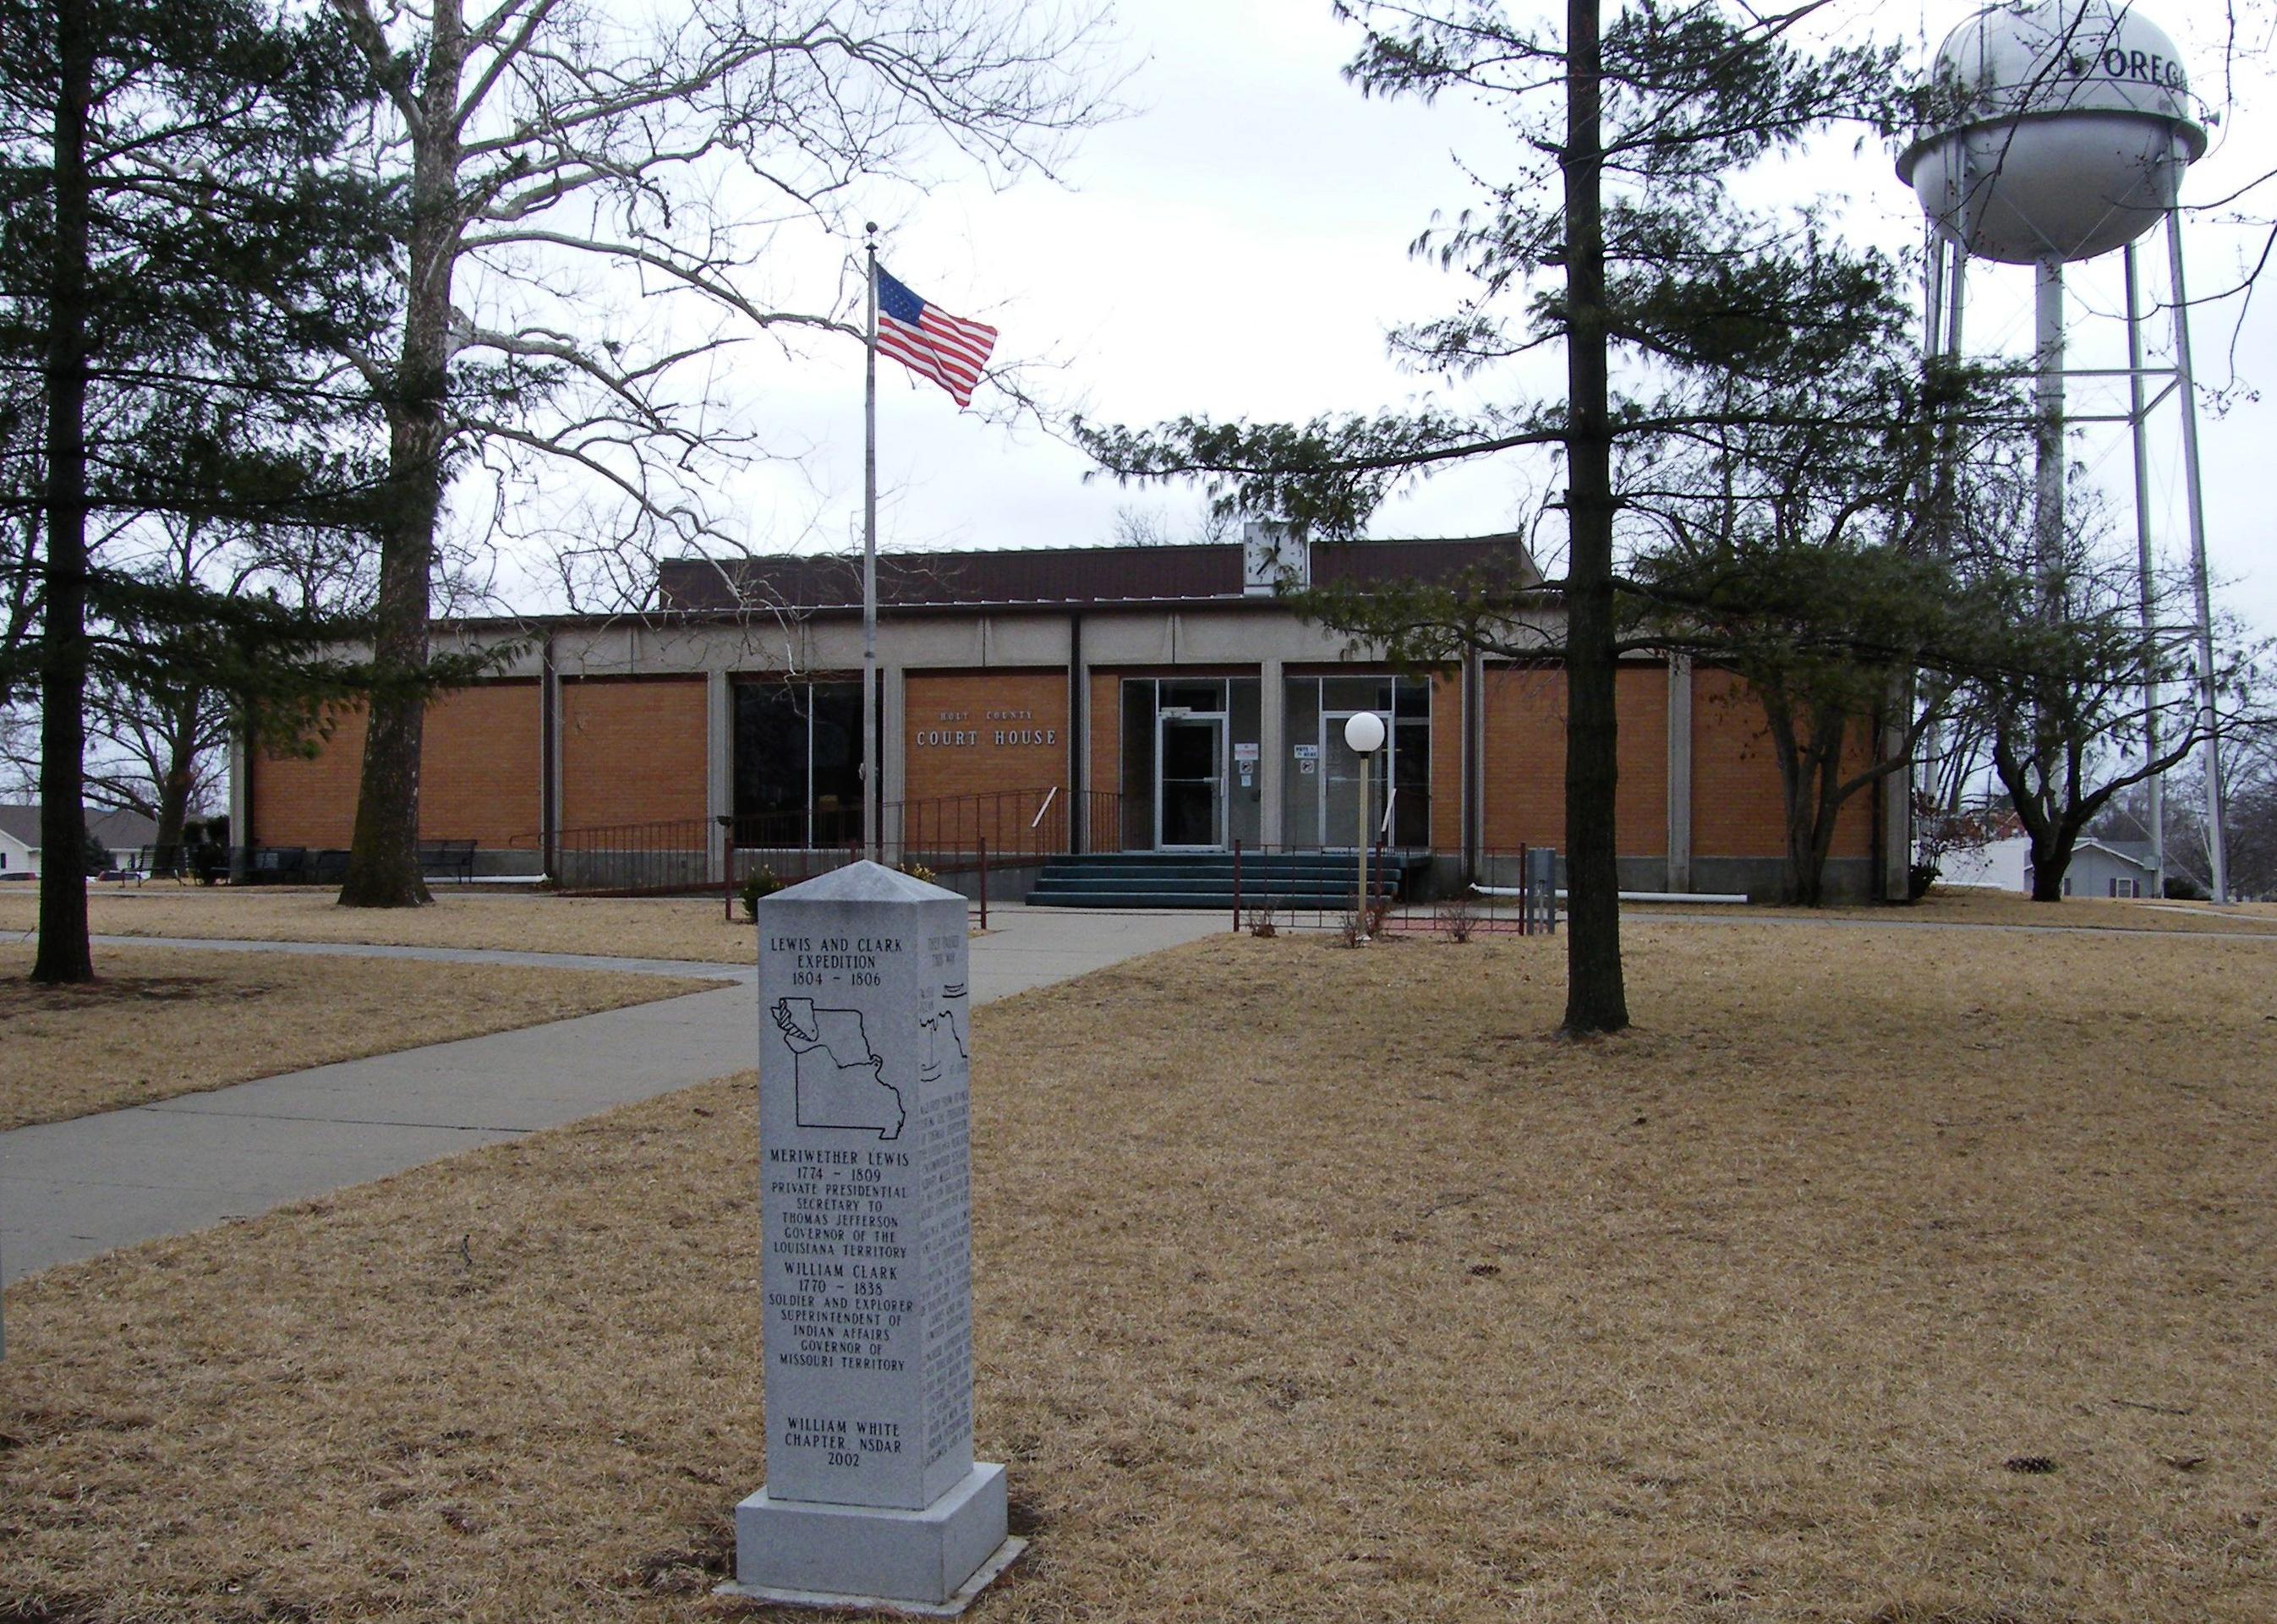
#1. Holt County
– Emergency shelters per 100K people: 302.7 (13 shelters in database)
– Emergency shelter capacity per 100K: 36,481,583 people (1,566,884 total capacity)
– Shelters with generators: 0
– Shelters in 100-year floodplain: 1