Counties with the highest rate of food insecure children in Missouri

Sean Pavone // Shutterstock
Counties with the highest rate of food insecure children in Missouri
Food insecurity is a widespread problem in the United States, with people experiencing food insecurity in every single county in the nation. The nonprofit Feeding America describes food insecurity as “a lack of consistent access to enough food for every person in a household to live an active, healthy life.”
Food insecurity hits children particularly hard. The USDA estimates that more than 5.5 million children lived in food-insecure households in 2021. Not having consistent access to enough food can affect cognitive abilities, overall health, moods, and attention spans—not to mention the psychological effects of living with scarcity.
Stacker compiled a list of counties in Missouri with the highest rate of food insecure children using data from Feeding America. Counties are ranked by highest percent of children with food insecurity as of 2020. Missouri has a child food insecurity rate of 14.1%, which ranks #25 highest among all states.
States with the highest rate of food insecure children
#1. Louisiana: 21.5%
#2. New Mexico: 20.5%
#3. Mississippi: 20.4%
#4. Alabama: 19.8%
#5. Arkansas: 19.7%
States with the lowest rate of food insecure children
#1. North Dakota: 8.1%
#2. Massachusetts: 8.8%
#3. New Jersey: 9.0%
#4. Minnesota: 9.3%
#5. New Hampshire: 9.5%
Read on to see where food insecurity is most prevalent in Missouri.
![]()

TommyBrison // Shutterstock
#50. St. Clair County
– Child food insecurity rate: 16.5% (310 total)
— 0.4% higher than national average
– Food insecurity rate: 15.2% (1,430 total)
— 3.4% higher than national average
– Annual food budget shortfall: $642,000
— Cost per meal: $2.79

David Wilson // Wikimedia Commons
#49. Pettis County
– Child food insecurity rate: 16.6% (1,740 total)
— 0.5% higher than national average
– Food insecurity rate: 14.0% (5,920 total)
— 2.2% higher than national average
– Annual food budget shortfall: $2,724,000
— Cost per meal: $2.86

Kbh3rd // Wikimedia Commons
#48. Barton County
– Child food insecurity rate: 16.7% (460 total)
— 0.6% higher than national average
– Food insecurity rate: 16.4% (1,920 total)
— 4.6% higher than national average
– Annual food budget shortfall: $892,000
— Cost per meal: $2.88

Parker Botanical // Wikimedia Commons
#47. Madison County
– Child food insecurity rate: 16.7% (470 total)
— 0.6% higher than national average
– Food insecurity rate: 15.3% (1,870 total)
— 3.5% higher than national average
– Annual food budget shortfall: $914,000
— Cost per meal: $3.04

Kbh3rd // Wikimedia Commons
#46. Maries County
– Child food insecurity rate: 16.7% (300 total)
— 0.6% higher than national average
– Food insecurity rate: 14.2% (1,250 total)
— 2.4% higher than national average
– Annual food budget shortfall: $576,000
— Cost per meal: $2.86

Vsmith // Wikimedia Commons
#45. Douglas County
– Child food insecurity rate: 16.8% (490 total)
— 0.7% higher than national average
– Food insecurity rate: 15.1% (2,010 total)
— 3.3% higher than national average
– Annual food budget shortfall: $975,000
— Cost per meal: $3.01

Bungaloid // Wikimedia Commons
#44. Cedar County
– Child food insecurity rate: 17.0% (580 total)
— 0.9% higher than national average
– Food insecurity rate: 15.4% (2,180 total)
— 3.6% higher than national average
– Annual food budget shortfall: $1,048,000
— Cost per meal: $2.99

Peek Creative Collective // Shutterstock
#43. Jasper County
– Child food insecurity rate: 17.2% (5,160 total)
— 1.1% higher than national average
– Food insecurity rate: 14.4% (17,370 total)
— 2.6% higher than national average
– Annual food budget shortfall: $8,300,000
— Cost per meal: $2.97

Original by Patrick Hull, modifications by Kbh3rd // Wikimedia Commons
#42. Worth County
– Child food insecurity rate: 17.2% (70 total)
— 1.1% higher than national average
– Food insecurity rate: 12.8% (260 total)
— 1.0% higher than national average
– Annual food budget shortfall: $135,000
— Cost per meal: $3.23

Kbh3rd // Wikimedia Commons
#41. Linn County
– Child food insecurity rate: 17.4% (490 total)
— 1.3% higher than national average
– Food insecurity rate: 13.2% (1,580 total)
— 1.4% higher than national average
– Annual food budget shortfall: $751,000
— Cost per meal: $2.95

Kbh3rd // Wikimedia Commons
#40. Pulaski County
– Child food insecurity rate: 17.5% (2,000 total)
— 1.4% higher than national average
– Food insecurity rate: 13.8% (7,220 total)
— 2.0% higher than national average
– Annual food budget shortfall: $3,778,000
— Cost per meal: $3.25

Americasroof // Wikimedia Commons
#39. Harrison County
– Child food insecurity rate: 17.6% (360 total)
— 1.5% higher than national average
– Food insecurity rate: 15.9% (1,340 total)
— 4.1% higher than national average
– Annual food budget shortfall: $690,000
— Cost per meal: $3.20

Kbh3rd // Wikimedia Commons
#38. Randolph County
– Child food insecurity rate: 17.6% (950 total)
— 1.5% higher than national average
– Food insecurity rate: 13.8% (3,420 total)
— 2.0% higher than national average
– Annual food budget shortfall: $1,537,000
— Cost per meal: $2.79

Lisa Fitzthum Photography // Shutterstock
#37. Camden County
– Child food insecurity rate: 17.7% (1,430 total)
— 1.6% higher than national average
– Food insecurity rate: 13.6% (6,250 total)
— 1.8% higher than national average
– Annual food budget shortfall: $3,336,000
— Cost per meal: $3.32

Sector001 // Wikimedia Commons
#36. Morgan County
– Child food insecurity rate: 17.7% (820 total)
— 1.6% higher than national average
– Food insecurity rate: 15.5% (3,160 total)
— 3.7% higher than national average
– Annual food budget shortfall: $1,474,000
— Cost per meal: $2.90

Kbh3rd // Wikimedia Commons
#35. Henry County
– Child food insecurity rate: 17.8% (860 total)
— 1.7% higher than national average
– Food insecurity rate: 15.4% (3,370 total)
— 3.6% higher than national average
– Annual food budget shortfall: $1,526,000
— Cost per meal: $2.81

M. Curtis // Shutterstock
#34. Laclede County
– Child food insecurity rate: 17.8% (1,570 total)
— 1.7% higher than national average
– Food insecurity rate: 15.3% (5,440 total)
— 3.5% higher than national average
– Annual food budget shortfall: $2,488,000
— Cost per meal: $2.84

Paul Sableman // Wikimedia Commons
#33. St. Francois County
– Child food insecurity rate: 17.9% (2,510 total)
— 1.8% higher than national average
– Food insecurity rate: 15.6% (10,420 total)
— 3.8% higher than national average
– Annual food budget shortfall: $5,151,000
— Cost per meal: $3.07

JERRYE & ROY KLOTZ MD // Wikimedia Commons
#32. McDonald County
– Child food insecurity rate: 18.0% (1,060 total)
— 1.9% higher than national average
– Food insecurity rate: 13.6% (3,110 total)
— 1.8% higher than national average
– Annual food budget shortfall: $1,585,000
— Cost per meal: $3.16

Charles W. Chapman // Wikimedia Commons
#31. Audrain County
– Child food insecurity rate: 18.2% (1,060 total)
— 2.1% higher than national average
– Food insecurity rate: 13.8% (3,490 total)
— 2.0% higher than national average
– Annual food budget shortfall: $1,623,000
— Cost per meal: $2.89

Kbh3rd // Wikimedia Commons
#30. Dade County
– Child food insecurity rate: 18.3% (290 total)
— 2.2% higher than national average
– Food insecurity rate: 13.9% (1,050 total)
— 2.1% higher than national average
– Annual food budget shortfall: $507,000
— Cost per meal: $3.00
Steveewatkins // Wikimedia Commons
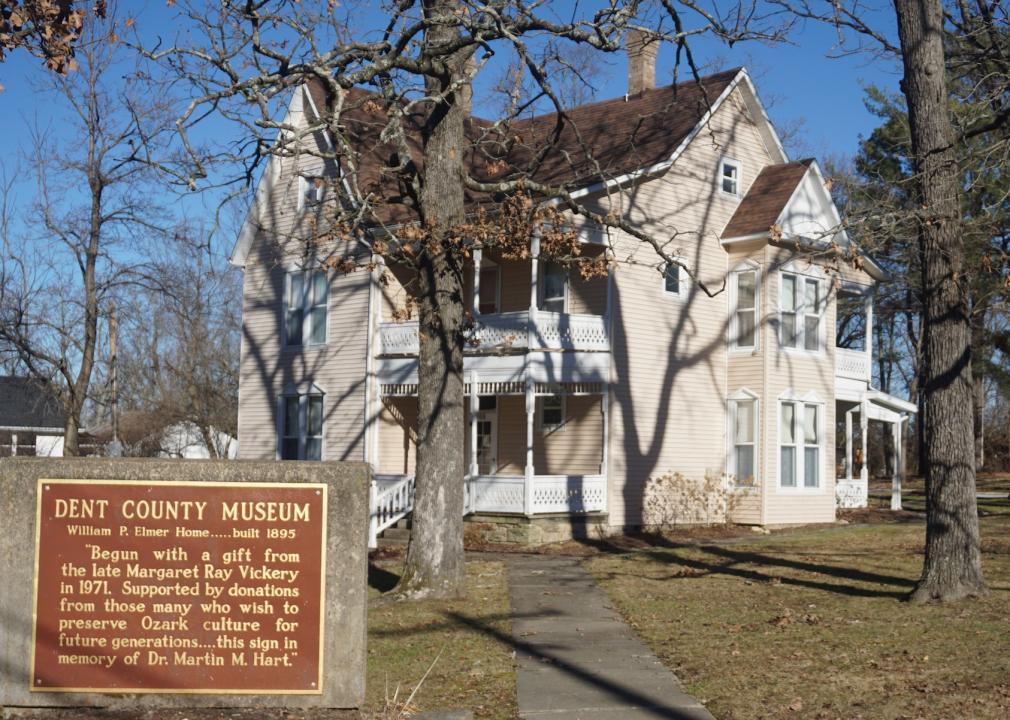
#29. Dent County
– Child food insecurity rate: 18.4% (640 total)
— 2.3% higher than national average
– Food insecurity rate: 15.4% (2,390 total)
— 3.6% higher than national average
– Annual food budget shortfall: $1,107,000
— Cost per meal: $2.88

Kbh3rd // Wikimedia Commons
#28. Crawford County
– Child food insecurity rate: 18.7% (1,020 total)
— 2.6% higher than national average
– Food insecurity rate: 16.0% (3,830 total)
— 4.2% higher than national average
– Annual food budget shortfall: $1,987,000
— Cost per meal: $3.22

Kbh3rd // Wikimedia Commons
#27. Lawrence County
– Child food insecurity rate: 18.7% (1,810 total)
— 2.6% higher than national average
– Food insecurity rate: 14.5% (5,550 total)
— 2.7% higher than national average
– Annual food budget shortfall: $2,675,000
— Cost per meal: $2.99

Jon Kraft // Shutterstock
#26. Jackson County
– Child food insecurity rate: 19.0% (31,350 total)
— 2.9% higher than national average
– Food insecurity rate: 12.3% (86,300 total)
— 0.5% higher than national average
– Annual food budget shortfall: $45,875,000
— Cost per meal: $3.30

Kbh3rd // Wikimedia Commons
#25. Barry County
– Child food insecurity rate: 19.1% (1,540 total)
— 3.0% higher than national average
– Food insecurity rate: 14.5% (5,170 total)
— 2.7% higher than national average
– Annual food budget shortfall: $2,467,000
— Cost per meal: $2.96

Kbh3rd // Wikimedia Commons
#24. Dallas County
– Child food insecurity rate: 19.1% (760 total)
— 3.0% higher than national average
– Food insecurity rate: 15.9% (2,670 total)
— 4.1% higher than national average
– Annual food budget shortfall: $1,249,000
— Cost per meal: $2.90

Kclibrarian // Wikimedia Commons
#23. Stone County
– Child food insecurity rate: 19.1% (1,010 total)
— 3.0% higher than national average
– Food insecurity rate: 14.4% (4,590 total)
— 2.6% higher than national average
– Annual food budget shortfall: $2,348,000
— Cost per meal: $3.18

Dazspell // Wikimedia Commons
#22. Scott County
– Child food insecurity rate: 19.4% (1,790 total)
— 3.3% higher than national average
– Food insecurity rate: 14.8% (5,710 total)
— 3.0% higher than national average
– Annual food budget shortfall: $2,761,000
— Cost per meal: $3.00

Brian Stansberry // Wikimedia Commons
#21. Stoddard County
– Child food insecurity rate: 19.5% (1,250 total)
— 3.4% higher than national average
– Food insecurity rate: 16.2% (4,740 total)
— 4.4% higher than national average
– Annual food budget shortfall: $2,250,000
— Cost per meal: $2.95

Kbh3rd // Wikimedia Commons
#20. Carter County
– Child food insecurity rate: 19.8% (290 total)
— 3.7% higher than national average
– Food insecurity rate: 16.8% (1,020 total)
— 5.0% higher than national average
– Annual food budget shortfall: $458,000
— Cost per meal: $2.79

Kbh3rd // Wikimedia Commons
#19. Reynolds County
– Child food insecurity rate: 20.8% (240 total)
— 4.7% higher than national average
– Food insecurity rate: 16.2% (1,020 total)
— 4.4% higher than national average
– Annual food budget shortfall: $496,000
— Cost per meal: $3.02

Kbh3rd // Wikimedia Commons
#18. Texas County
– Child food insecurity rate: 20.8% (1,150 total)
— 4.7% higher than national average
– Food insecurity rate: 17.2% (4,400 total)
— 5.4% higher than national average
– Annual food budget shortfall: $2,094,000
— Cost per meal: $2.96

Americasroof // Wikimedia Commons
#17. Washington County
– Child food insecurity rate: 21.1% (1,220 total)
— 5.0% higher than national average
– Food insecurity rate: 17.6% (4,380 total)
— 5.8% higher than national average
– Annual food budget shortfall: $1,995,000
— Cost per meal: $2.83

Kbh3rd // Wikimedia Commons
#16. Howell County
– Child food insecurity rate: 21.4% (2,060 total)
— 5.3% higher than national average
– Food insecurity rate: 18.3% (7,360 total)
— 6.5% higher than national average
– Annual food budget shortfall: $3,372,000
— Cost per meal: $2.85

Kbh3rd // Wikimedia Commons
#15. Iron County
– Child food insecurity rate: 21.6% (460 total)
— 5.5% higher than national average
– Food insecurity rate: 18.3% (1,860 total)
— 6.5% higher than national average
– Annual food budget shortfall: $910,000
— Cost per meal: $3.04

christopher friese // Wikimedia Commons
#14. Shannon County
– Child food insecurity rate: 21.6% (380 total)
— 5.5% higher than national average
– Food insecurity rate: 19.9% (1,630 total)
— 8.1% higher than national average
– Annual food budget shortfall: $747,000
— Cost per meal: $2.85

Kbh3rd // Wikimedia Commons
#13. Wright County
– Child food insecurity rate: 21.7% (1,020 total)
— 5.6% higher than national average
– Food insecurity rate: 16.9% (3,090 total)
— 5.1% higher than national average
– Annual food budget shortfall: $1,470,000
— Cost per meal: $2.96

Dean Sebourn // Wikimedia Commons
#12. Ripley County
– Child food insecurity rate: 21.9% (670 total)
— 5.8% higher than national average
– Food insecurity rate: 19.4% (2,610 total)
— 7.6% higher than national average
– Annual food budget shortfall: $1,165,000
— Cost per meal: $2.77

Skye Marthaler // Wikimedia Commons
#11. Butler County
– Child food insecurity rate: 22.0% (2,210 total)
— 5.9% higher than national average
– Food insecurity rate: 18.1% (7,720 total)
— 6.3% higher than national average
– Annual food budget shortfall: $3,446,000
— Cost per meal: $2.77

Brian Hunter // Wikimedia Commons
#10. Benton County
– Child food insecurity rate: 22.1% (740 total)
— 6.0% higher than national average
– Food insecurity rate: 16.7% (3,220 total)
— 4.9% higher than national average
– Annual food budget shortfall: $1,466,000
— Cost per meal: $2.83

Kbh3rd // Wikimedia Commons
#9. Ozark County
– Child food insecurity rate: 23.3% (410 total)
— 7.2% higher than national average
– Food insecurity rate: 18.8% (1,720 total)
— 7.0% higher than national average
– Annual food budget shortfall: $909,000
— Cost per meal: $3.28

Joseph Sohm // Shutterstock
#8. New Madrid County
– Child food insecurity rate: 23.6% (950 total)
— 7.5% higher than national average
– Food insecurity rate: 16.3% (2,810 total)
— 4.5% higher than national average
– Annual food budget shortfall: $1,372,000
— Cost per meal: $3.03

Lilith Munck // Shutterstock
#7. Taney County
– Child food insecurity rate: 24.0% (2,820 total)
— 7.9% higher than national average
– Food insecurity rate: 17.8% (9,910 total)
— 6.0% higher than national average
– Annual food budget shortfall: $5,122,000
— Cost per meal: $3.21

Kbh3rd // Wikimedia Commons
#6. Dunklin County
– Child food insecurity rate: 24.1% (1,830 total)
— 8.0% higher than national average
– Food insecurity rate: 18.0% (5,340 total)
— 6.2% higher than national average
– Annual food budget shortfall: $2,391,000
— Cost per meal: $2.78

Kbh3rd // Wikimedia Commons
#5. Oregon County
– Child food insecurity rate: 24.3% (580 total)
— 8.2% higher than national average
– Food insecurity rate: 19.7% (2,080 total)
— 7.9% higher than national average
– Annual food budget shortfall: $958,000
— Cost per meal: $2.86

Kbh3rd // Wikimedia Commons
#4. Wayne County
– Child food insecurity rate: 24.8% (650 total)
— 8.7% higher than national average
– Food insecurity rate: 20.2% (2,630 total)
— 8.4% higher than national average
– Annual food budget shortfall: $1,180,000
— Cost per meal: $2.79

Brian Stansberry // Wikimedia Commons
#3. Mississippi County
– Child food insecurity rate: 25.0% (700 total)
— 8.9% higher than national average
– Food insecurity rate: 17.6% (2,340 total)
— 5.8% higher than national average
– Annual food budget shortfall: $1,140,000
— Cost per meal: $3.03

Sean Pavone // Shutterstock
#2. St. Louis
– Child food insecurity rate: 29.4% (17,100 total)
— 13.3% higher than national average
– Food insecurity rate: 15.8% (48,260 total)
— 4.0% higher than national average
– Annual food budget shortfall: $30,219,000
— Cost per meal: $3.89

Brian Stansberry // Wikimedia Commons
#1. Pemiscot County
– Child food insecurity rate: 33.0% (1,390 total)
— 16.9% higher than national average
– Food insecurity rate: 21.5% (3,510 total)
— 9.7% higher than national average
– Annual food budget shortfall: $1,587,000
— Cost per meal: $2.81