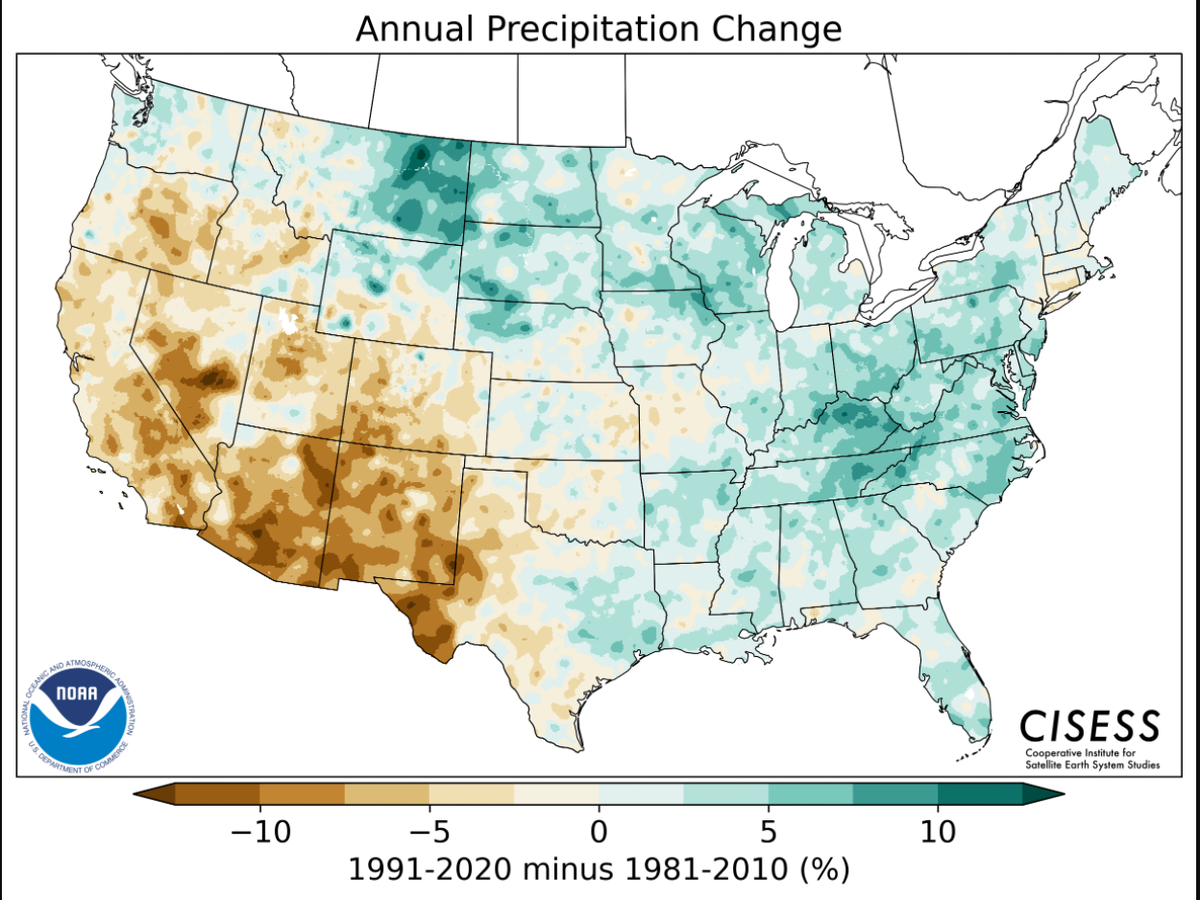
New climate normals: What this new data means
The National Oceanic and Atmospheric Administration has released its new climate normals map but what do these maps mean?
Let’s face it, climate change is a hot topic right now. For many people, it's a triggering topic that has been made political within recent years. This story isn’t meant to be political, it’s meant to be scientific! Climate data is collected over a span of 30 years, so this new data is coming from 1991-2020 with 2021’s data still coming in.

This data shows that much of the United States is averaging to be warmer than in years past. Here in mid-Missouri, we’re seeing average temperatures about half a degree warmer across the board.

Precipitation trends vary more than temperature trends do. In fact, most of the East Coast is seeing more precipitation whereas the west is mainly trending to be drier. Here in mid-Missouri, it appears that we are actually seeing drier conditions.
https://www.ncei.noaa.gov/news/noaa-delivers-new-us-climate-normals
