How atmospheric waves can indicate weather patterns
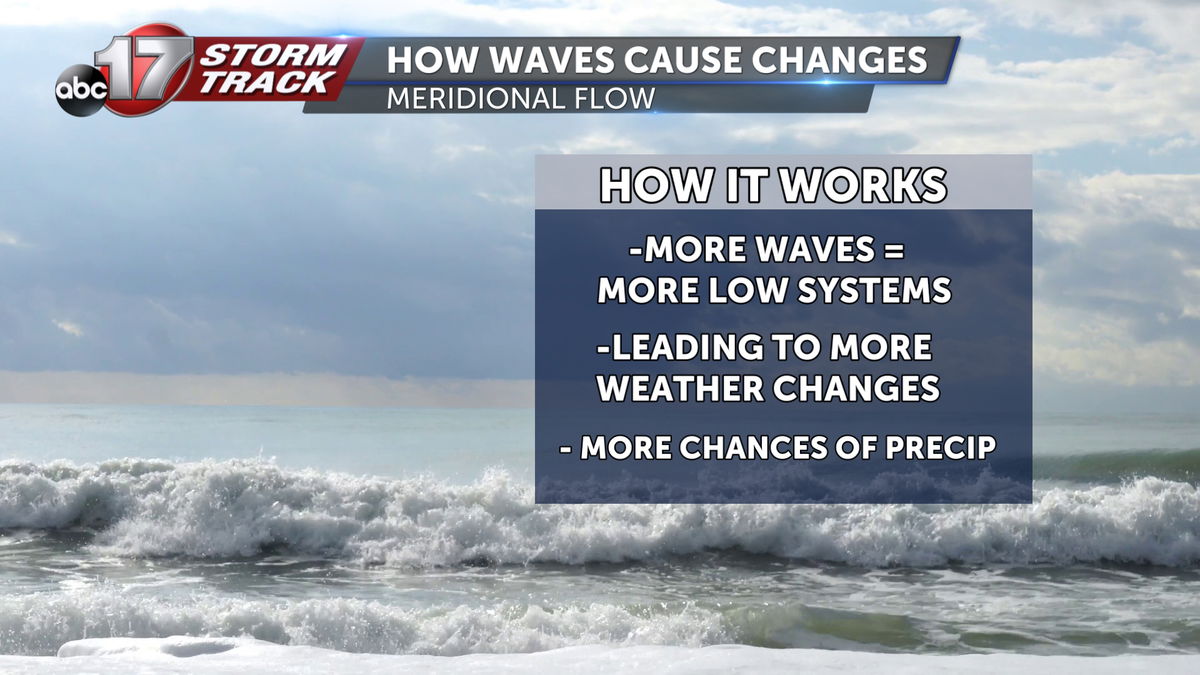
When meteorologists are typically looking at waves, it's not always on a sandy beach looking into the ocean. It could be looking at atmospheric graphs. When there increased waves on an atmospheric graphs, changing weather can be expected more frequently.

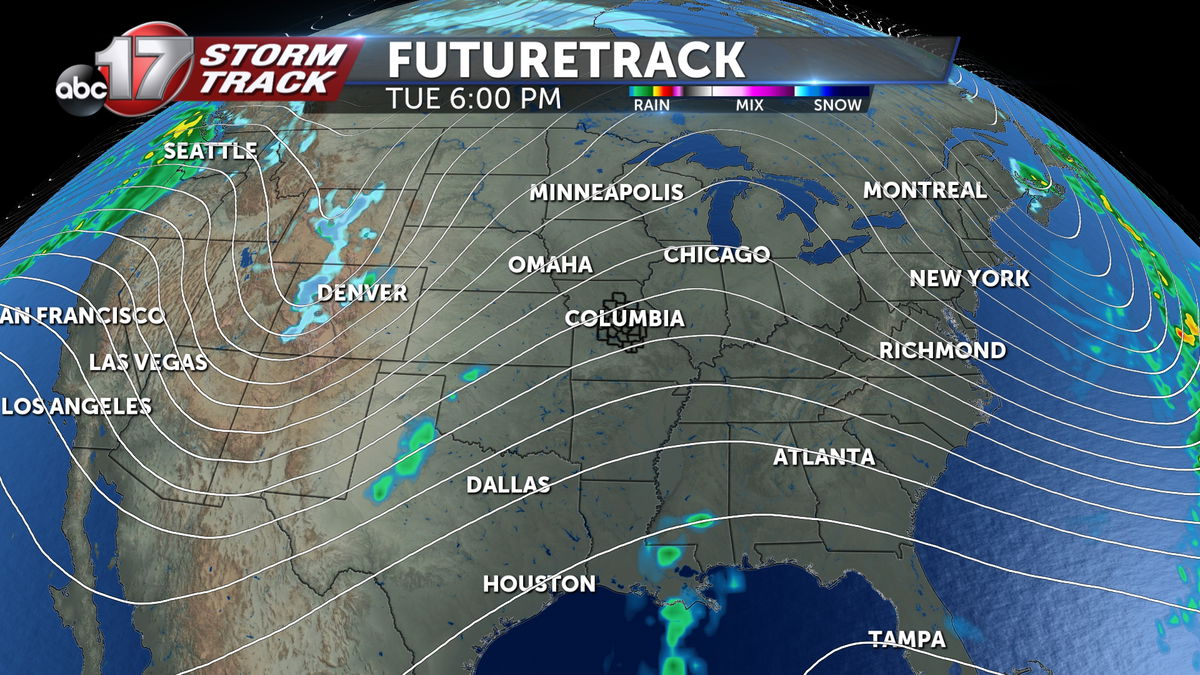
The white lines show on the ABC 17 Stormtrack Futuretrack are known as isobars which represent equal lines of pressure at a given level in the atmosphere. These lines can determine one of two primary categories of conditions in the atmosphere; zonal and meridional flow. High pressure systems can often be identified by hill like features created with these isobars. Low pressure systems are often referred to as low pressure troughs because they look like a valley dipping low.

Whenever the United States sees meridional flow overhead on these pressure charts, there can be an expectation many times of more weather patterns changing. If there is enough moisture present, this can also mean increased chances of rain/ snow depending on the temperatures.

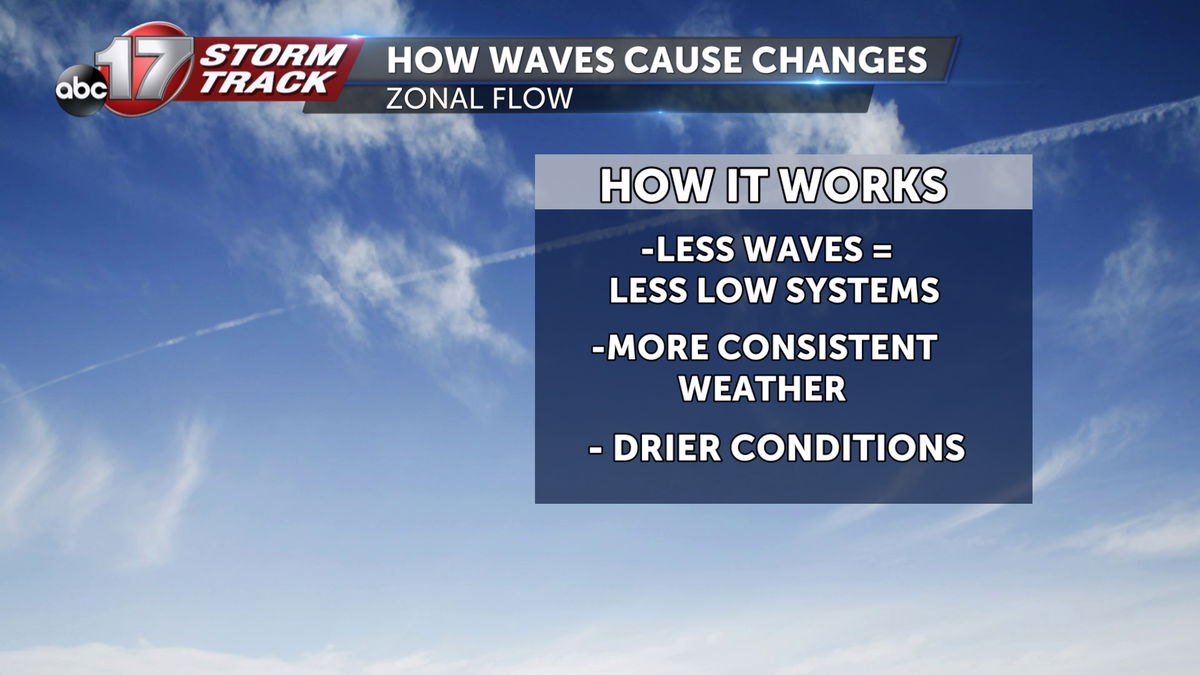
Whenever isobars are more east to west oriented almost showing close to straight line conditions, there is often less change in weather conditions and stagnant patterns will most likely take hold. This often leads to longer dry periods across regions.

Looking further into Mid-Missouri's future, extended precipitation outlooks are showing wetter than average conditions which can also be seen in future model runs as a more meridional flow appears on graphs.
