The 10 best tax-friendly states—and the 10 worst

Canva
The 10 best tax-friendly states—and the 10 worst
Aerial view of high rises in Chicago.
Every state handles taxes a little differently, and which state you live in can impact your wallet. As you prepare your state tax return this year, it might not be the first time you, and other Americans, ask, “Is living here worth the taxes?”
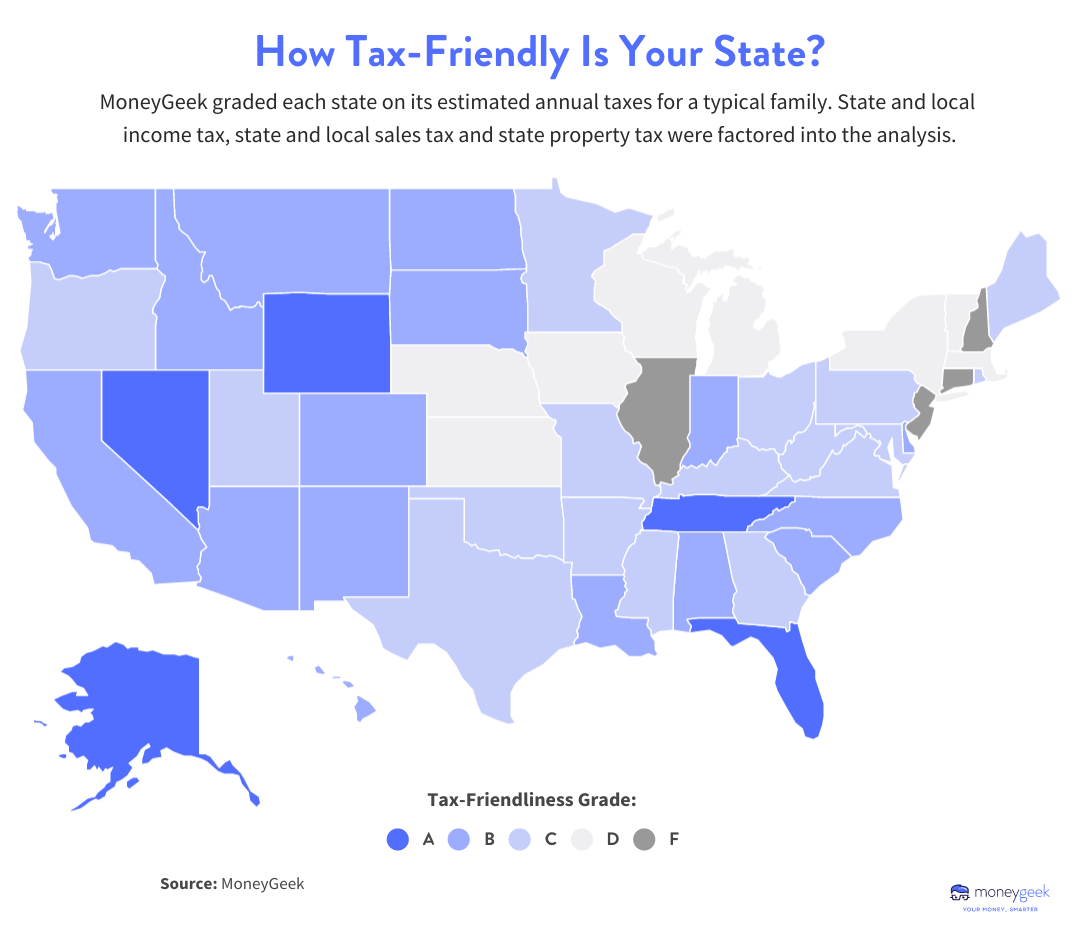
To assess the tax-friendliness of all 50 states and the District of Columbia, MoneyGeek analyzed data from the U.S. Census Bureau, the Tax Foundation and the U.S. Bureau of Labor Statistics’ Consumer Expenditure survey to calculate taxes paid in each state. MoneyGeek awarded each state a tax-friendliness grade, giving an “A” to the states with the smallest tax burden and an “F” to the states with the largest. MoneyGeek considered sales, income and property taxes in its calculations. The analysis also explored how each state’s tax-friendliness rating related to its population growth from 2021 to 2022.
![]()
MoneyGeek
Key findings
A heat map grading tax-friendly states across the US.
- Illinois is the least tax-friendly state; there, families pay $14,778 in annual taxes. Wyoming is the most tax-friendly state, where residents pay $3,438.
- For a typical middle-class family, the tax burden difference between living in the highest-tax state (Illinois) and the lowest-tax state (Wyoming) is $11,340 per year.
- States that received an A in tax-friendliness experienced above-average population growth (1%); states with an F saw below-average growth (0.1%).
- Florida, which received an A and ranked as the fifth most tax-friendly state in the nation, saw a 2.1% increase in its population growth — the largest of any state.
- New York, which received a D and ranked as the fifth-worst state for tax burdens, saw the biggest population decline (-0.8%) in the U.S.
MoneyGeek
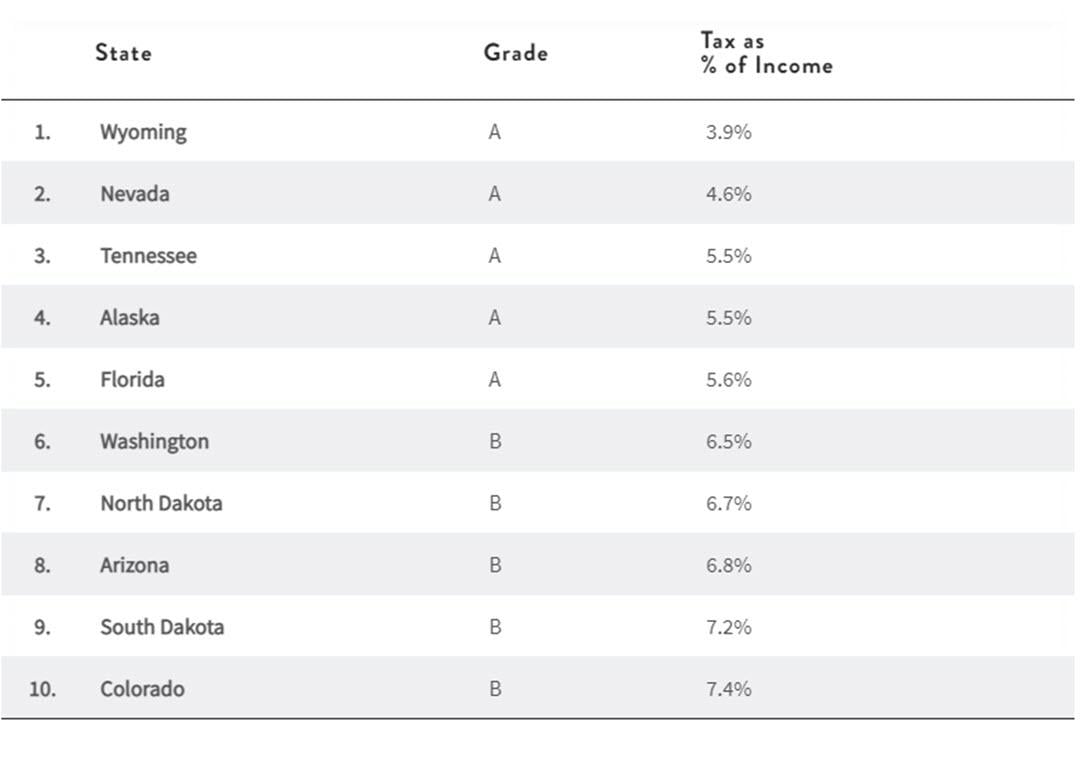
Wyoming, Nevada lead the 10 most tax-friendly states in America
Table showing states with the lowest tax burdens.
To find the most tax-friendly states in America, MoneyGeek estimated the state taxes paid by a typical middle-class family. In this analysis, a typical middle-class family was defined as a married couple with one dependent making the median national income ($87,432) and owning a home valued at the national median ($374,665).
MoneyGeek’s analysis found that Wyoming is the most tax-friendly state in America, followed by Nevada, Tennessee, Florida and Alaska. States that received a grade of A all share something in common: no state income tax. Washington and South Dakota — which both received a B — also have no state income tax. On average, taxes in the most tax-friendly states only comprised 6% of the typical household’s income.
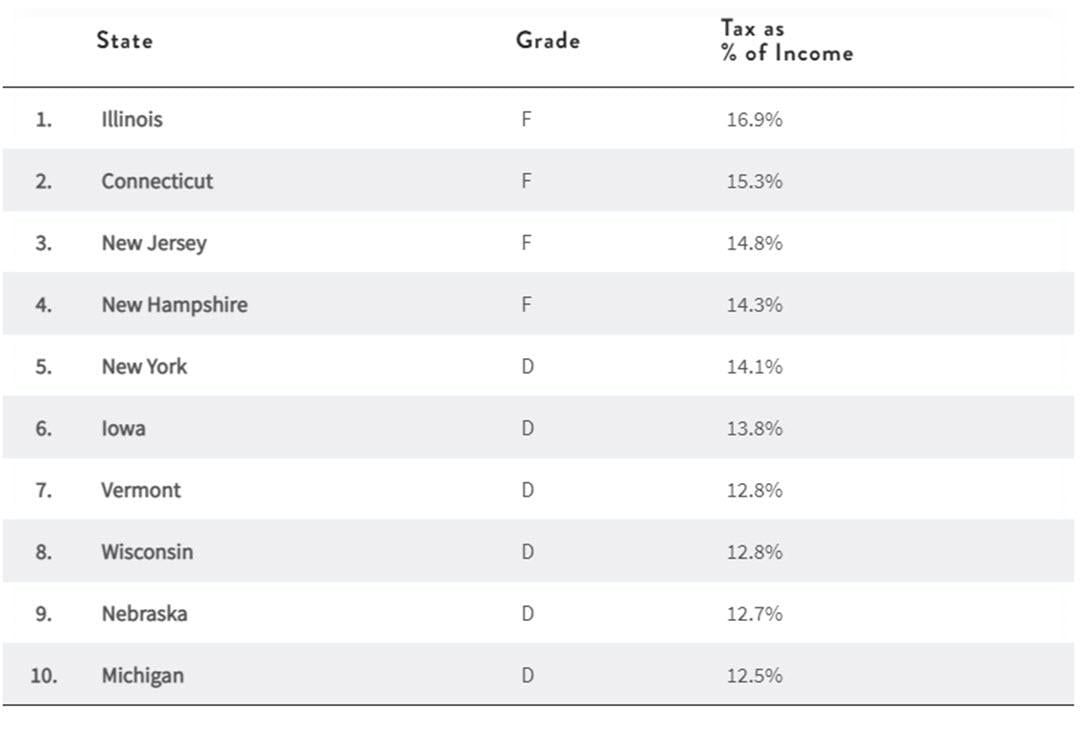
On the other hand, taxes made up 14% of a typical family’s income in the 10 states with the highest tax burdens. In Illinois — the least tax-friendly state in America and 1 of 4 states to receive an F grade in this analysis — taxes make up an eye-popping 17% of household income.
Notably, 9 of the 10 least tax-friendly states are located in either New England or the Midwest, with the exception of Nebraska.
MoneyGeek
Analysis shows higher population growth in lower tax states
A table showing states with the highest tax burdens.
For many, the pandemic altered their perceptions about where they want to live and where they can live. Millions of city-weary residents aching for more space — and having more mobility due to the rise in popularity of remote work — have relocated in recent years. Have taxes influenced their decision to move to a new state? MoneyGeek’s analysis suggests that the answer is “yes.”
Analysis of state tax burden rates and the change in population from 2021 to 2022, as estimated by the U.S. Census Bureau, shows that taxes and population growth are related in some states.
While the average population growth in the U.S. was 0.5%, the most tax-friendly states (those that received an A grade) saw above-average population growth at 1%. Florida — awarded an A grade and ranked as the fifth most tax-friendly state — saw the highest population growth in the nation at 2.1%. Nevada (No. 2) and Tennessee (No.3) — both A-graded states — also saw above-average growth at 1.1% each.
Of the four states with an F grade, two had population declines in 2022. Among the eight states with a D grade, three — New York, Wisconsin and Michigan — saw population declines. Other D-grade states (Nebraska, Iowa and Vermont) saw no population growth or growth below the national average.

Canva
Methodology
A 1040 tax form lies beneath a tax refund check.
To calculate the least and most tax-friendly states in America, MoneyGeek researched income and sales tax rates by state using data from the Tax Foundation. Property tax rates were sourced from RocketMortgage.
Using expenditure and income data from the Bureau of Labor Statistics’ Consumer Expenditure Survey, income data from the U.S. Census Bureau and housing data from Zillow, MoneyGeek constructed a hypothetical family with one dependent, a gross income of $87,432 (the median national income at the time of research) and a home worth $374,665 (the median new home price at the time of research).
MoneyGeek then estimated the state taxes this hypothetical family would pay in each state. This includes a calculation of the federal tax rate to identify deductions if and where appropriate. States were ranked based on the estimated total taxes and assigned letter grades from A to E based on the size of the tax payment:
- Grade A: $3,438–$5,705
- Grade B: $5,706–$7,973
- Grade C: $7,974–$10,241
- Grade D: $10,242–$12,509
- Grade E: $12,510–$14,778
Population growth information was sourced from the U.S. Census Bureau.
SOURCES
- Tax Foundation. “State and Local Sales Tax Rates, 2022.” Accessed January 13, 2023.
- Tax Foundation. “State Individual Income Tax Rates and Brackets for 2022.” Accessed January 13, 2023.
- U.S. Bureau of Labor Statistics. “Consumer Expenditures – 2021.” Accessed January 13, 2023.
- U.S. Census Bureau. “Census Bureau Median Family Income By Family Size.” Accessed January 13, 2023.
- U.S. Census Bureau. “Population Estimates, Population Change, and Components of Change.” Accessed January 13, 2023.
- Zillow Home Value Index. “Housing Data.” Accessed January 13, 2023.
- Rocket Mortgage. “Property Taxes By State: A Comparative Look At The Highest To Lowest States.” Accessed February 24, 2023.
This story originally appeared on MoneyGeek and has been independently reviewed to meet journalistic standards.