Jobs with the highest divorce rates

Bacho // Shutterstock
Jobs with the highest divorce rates
Hands passing ring over divorce papers.
While public perception is that half of all American marriages end in divorce, that statistic is actually much lower. The divorce rate in the U.S. peaked with those who married in the 1970s, nearly half of whom were divorced within 25 years.
Generations since then have divorced less often, though older gen-Xers and baby boomers are divorcing at twice the rates people their age were in the 1990s, according to a Pew Research Center analysis of the 2015 American Community Survey. University of Maryland sociology professor Philip Cohen examined American Community Survey data from 2008 to 2016, and found that millennials are divorcing at particularly low rates.
The reasons for divorce are complicated and vary across demographics and age. But one factor shows a strong predictor for long-term marital success: occupation.
People with stable, higher-paying jobs tend to experience lower divorce rates than those who don’t earn as much money, according to research Nathan Yau compiled from the 2019 American Community Survey. A 2017 Institute for Family Studies report found less than one-third of married people in the middle and upper classes filed for divorce, while more than one-third of those in the working class had sought divorces.
Using 2021 American Community Survey data, sourced via the Integrated Public Use Microdata Series, Stacker ranked the 50 U.S. jobs with the highest divorce rates, breaking ties by separation rates. People who never married are excluded from these calculations. Data looks only at current marital status, so those who were previously divorced but have since gotten remarried are not counted among divorced people. Stacker only considered occupations with a sample size larger than 100.
The analysis also includes 2021 employment and wage data for occupations, sourced from the Bureau of Labor Statistics, which don’t factor into the ranking.
Interestingly, unemployed people who either haven’t had a job in the past five-plus years or never worked had a divorce rate of 22.7%, which was lower than more than half the occupations on the list.
It stands to reason that married couples who are less likely to encounter financial hardships will have a better chance of staying together. If both people in a marriage have high-paying jobs, they can use their combined wealth in mutually beneficial ways. Pharmacists, lawyers, and architects—fields that offer high average annual salaries and significant job stability—will have more money to provide for a family and pay their bills, can enjoy luxuries such as vacations, and generally lead fulfilling lives.
Jobs with relatively low pay and irregular hours, like bartending or waiting tables, can cause a financial strain on a marriage. From another standpoint, those with jobs that require a lot of travel, like flight attendants or entertainers, may face marital stress because they’re forced to spend a lot of time away from home. Others with physically demanding occupations often encounter low pay, long hours, and dangerous working conditions—each of which can lead to potential complications at home.
Continue reading to find out which jobs have the highest divorce rates in the U.S.
You may also like: Youngest billionaires in America
![]()

Pressmaster // Shutterstock
#50. Baggage porters, bellhops, and concierges
A bellhop takes a suitcase off a cart.
– Divorce rate: 21.2%
– Separation rate: 3.3%
– Average annual salary: $33,780 ($24,480 lower than national average)
– Nationwide employment: 27,045

LuckView // Shutterstock
#49. Cutting, punching, and press machine setters, operators, and tenders, metal and plastic
A gloved hand operates a small machine.
– Divorce rate: 21.2%
– Separation rate: 3.4%
– Average annual salary: $40,000 ($18,260 lower than national average)
– Nationwide employment: 179,630

Byjeng // Shutterstock
#48. Structural metal fabricators and fitters
Sheet metal bending in factory.
– Divorce rate: 21.3%
– Separation rate: 1.1%
– Average annual salary: $45,730 ($12,530 lower than national average)
– Nationwide employment: 61,070

Igor_Koptilin // Shutterstock
#47. Security guards and gaming surveillance officers
A security guard uses a flashlight to inspect the inside of a gambling machine.
– Divorce rate: 21.3%
– Separation rate: 4.0%
– Average annual salary: $36,955 ($21,305 lower than national average)
– Nationwide employment: 533,145

fizkes // Shutterstock
#46. Public safety telecommunicators
A woman talking on a headset sits behind a computer.
– Divorce rate: 21.4%
– Separation rate: 1.8%
– Average annual salary: $47,030 ($11,230 lower than national average)
– Nationwide employment: 97,050
You may also like: America’s most and least trusted professions

Dmitry Kalinovsky // Shutterstock
#45. Laundry and dry-cleaning workers
A woman irons a shirt.
– Divorce rate: 21.4%
– Separation rate: 6.7%
– Average annual salary: $27,830 ($30,430 lower than national average)
– Nationwide employment: 157,400

fizkes // Shutterstock
#44. Counselors, all other
Close up of counselor holding clipboard and touching patient hands.
– Divorce rate: 21.5%
– Separation rate: 1.7%
– Average annual salary: $49,730 ($8,530 lower than national average)
– Nationwide employment: 29,480

Rawpixel.com // Shutterstock
#43. Substance abuse and behavioral disorder counselors
A smiling woman stands in front of a white board with the words mental health, and solve and discuss.
– Divorce rate: 21.6%
– Separation rate: 1.4%
– Average annual salary: $53,490 ($4,770 lower than national average)
– Nationwide employment: 310,880

Paul Sableman // Flickr
#42. Bus drivers, transit and intercity
A woman drives a bus.
– Divorce rate: 21.6%
– Separation rate: 2.9%
– Average annual salary: $51,310 ($6,950 lower than national average)
– Nationwide employment: 145,720

Canva
#41. Crossing guards and flaggers
An older man in an orange vest holds up a stop sign as he walks a little girl in a school uniform across the street.
– Divorce rate: 21.7%
– Separation rate: 3.4%
– Average annual salary: $35,670 ($22,590 lower than national average)
– Nationwide employment: 82,690
You may also like: 25 richest families in America

Glenn Highcove // Shutterstock
#40. Industrial truck and tractor operators
A man drives a John Deere tractor.
– Divorce rate: 21.7%
– Separation rate: 5.1%
– Average annual salary: $40,950 ($17,310 lower than national average)
– Nationwide employment: 758,290

Monkey Business Images // Shutterstock
#39. Interviewers, except eligibility and loan
A smiling woman sits across from another woman at a desk.
– Divorce rate: 21.8%
– Separation rate: 3.1%
– Average annual salary: $38,840 ($19,420 lower than national average)
– Nationwide employment: 169,840

Canva
#38. Refuse and recyclable material collectors
A blue waste management truck being driven down the road.
– Divorce rate: 21.9%
– Separation rate: 5.8%
– Average annual salary: $42,780 ($15,480 lower than national average)
– Nationwide employment: 126,050

Syda Productions // Shutterstock
#37. Executive secretaries and executive administrative assistants
A women sitting behind a computer, writes in a notebook and speaks on the phone.
– Divorce rate: 22.0%
– Separation rate: 1.7%
– Average annual salary: $66,870 ($8,610 higher than national average)
– Nationwide employment: 466,910

Monkey Business Images // Shutterstock
#36. Waiters and waitresses
A waitress places plates of food in front of customers at a restaurant.
– Divorce rate: 22.2%
– Separation rate: 5.1%
– Average annual salary: $29,010 ($29,250 lower than national average)
– Nationwide employment: 1,804,030
You may also like: Jobs with the highest fatality rates in the US

Rawpixel.com // Shutterstock
#35. Maids and housekeeping cleaners
A maid placing a pillow on a bed.
– Divorce rate: 22.2%
– Separation rate: 6.2%
– Average annual salary: $29,580 ($28,680 lower than national average)
– Nationwide employment: 723,430

Daniel M Ernst // Shutterstock
#34. Eligibility interviewers, government programs
A woman interviews another woman at a table.
– Divorce rate: 22.5%
– Separation rate: 2.7%
– Average annual salary: $48,570 ($9,690 lower than national average)
– Nationwide employment: 151,340

Dean Drobot // Shutterstock
#33. Cashiers
A shopper hands a credit card to a cashier at a grocery store.
– Divorce rate: 22.6%
– Separation rate: 4.9%
– Average annual salary: $27,950 ($30,310 lower than national average)
– Nationwide employment: 1,667,585

Antoine Taveneaux // Wikimedia Commons
#32. Gambling services workers
A Blackjack dealer deals cards at a table in a casino.
– Divorce rate: 22.7%
– Separation rate: 3.0%
– Average annual salary: $29,953 ($28,307 lower than national average)
– Nationwide employment: 27,620

Canva
#31. Models, demonstrators, and product promoters
Hands passing papers across a table full of marketing materials.
– Divorce rate: 22.8%
– Separation rate: 4.2%
– Average annual salary: $18,491 ($39,769 lower than national average)
– Nationwide employment: 21,340
You may also like: The most common jobs in America today

ID1974 // Shutterstock
#30. Mail clerks and mail machine operators, except postal service
Mail traveling on the conveyor belt.
– Divorce rate: 22.8%
– Separation rate: 5.4%
– Average annual salary: $34,390 ($23,870 lower than national average)
– Nationwide employment: 69,400

Canva
#29. Transportation service attendants
A man smiles in front of gas pumps.
– Divorce rate: 22.9%
– Separation rate: 3.3%
– Average annual salary: $34,300 ($23,960 lower than national average)
– Nationwide employment: 61,825

Pxhere
#28. Metal furnace operators, tenders, pourers, and casters
Bright red and orange molten material being poured.
– Divorce rate: 23.0%
– Separation rate: 4.3%
– Average annual salary: $45,675 ($12,585 lower than national average)
– Nationwide employment: 11,055

Monkey Business Images // Shutterstock
#27. Medical transcriptionists
A women in scrubs at a computer.
– Divorce rate: 23.1%
– Separation rate: 0.7%
– Average annual salary: $34,220 ($24,040 lower than national average)
– Nationwide employment: 55,830

Tyler Olson // Shutterstock
#26. Phlebotomists
A phlebotomist checks the veins on a women’s arm.
– Divorce rate: 23.2%
– Separation rate: 3.7%
– Average annual salary: $38,450 ($19,810 lower than national average)
– Nationwide employment: 132,750
You may also like: 5 ways to take the stress out of traveling for work

Nejron Photo // Shutterstock
#25. Supervisors of personal care and service workers
– Divorce rate: 23.2%
– Separation rate: 4.2%
– Average annual salary: $48,483 ($9,777 lower than national average)
– Nationwide employment: 62,467

Dragon Images // Shutterstock
#24. Hosts and hostesses, restaurant, lounge, and coffee shop
– Divorce rate: 23.3%
– Separation rate: 3.3%
– Average annual salary: $26,000 ($32,260 lower than national average)
– Nationwide employment: 324,690

GagliardiPhotography // Shutterstock
#23. Nursing assistants
– Divorce rate: 23.6%
– Separation rate: 5.6%
– Average annual salary: $33,250 ($25,010 lower than national average)
– Nationwide employment: 1,314,830

Gabriel Georgescu // Shutterstock
#22. Hotel, motel, and resort desk clerks
– Divorce rate: 23.7%
– Separation rate: 5.0%
– Average annual salary: $28,040 ($30,220 lower than national average)
– Nationwide employment: 220,380

Ryan Everton // Unsplash
#21. Dishwashers
– Divorce rate: 23.8%
– Separation rate: 7.3%
– Average annual salary: $27,350 ($30,910 lower than national average)
– Nationwide employment: 377,040
You may also like: Comparing minimum wage to the cost of living in every state

Efired // Shutterstock
#20. Bill and account collectors
– Divorce rate: 23.9%
– Separation rate: 2.2%
– Average annual salary: $41,280 ($16,980 lower than national average)
– Nationwide employment: 212,900

ESB Professional // Shutterstock
#19. Home health aides
Young woman helping old man to stand up.
– Divorce rate: 23.9%
– Separation rate: 7.3%
– Average annual salary: $29,260 ($29,000 lower than national average)
– Nationwide employment: 3,366,480

BlurryMe // Shutterstock
#18. Healthcare diagnosing or treating practitioners, all other
– Divorce rate: 24.1%
– Separation rate: 0.8%
– Average annual salary: $113,230 ($54,970 higher than national average)
– Nationwide employment: 26,250

Mirnes // Shutterstock
#17. Extruding, forming, pressing, and compacting machine setters, operators, and tenders
– Divorce rate: 24.1%
– Separation rate: 2.5%
– Average annual salary: $40,050 ($18,210 lower than national average)
– Nationwide employment: 56,570

Juri Pozzi // Shutterstock
#16. Acupuncturists
– Divorce rate: 24.2%
– Separation rate: 0.9%
– Average annual salary: $71,770 ($13,510 higher than national average)
– Nationwide employment: 7,250
You may also like: Former jobs of every Supreme Court justice

Canva
#15. Machine feeders and offbearers
– Divorce rate: 24.4%
– Separation rate: 3.4%
– Average annual salary: $36,660 ($21,600 lower than national average)
– Nationwide employment: 60,880

Vasin Lee // Shutterstock
#14. Residential advisors
– Divorce rate: 24.6%
– Separation rate: 5.3%
– Average annual salary: $34,950 ($23,310 lower than national average)
– Nationwide employment: 92,500

Pexels
#13. Ushers, lobby attendants, and ticket takers
– Divorce rate: 24.7%
– Separation rate: 1.3%
– Average annual salary: $26,390 ($31,870 lower than national average)
– Nationwide employment: 54,970

Canva
#12. Other grounds maintenance workers
– Divorce rate: 25.0%
– Separation rate: 0.7%
– Average annual salary: $39,810 ($18,450 lower than national average)
– Nationwide employment: 20,795

viktoriia varvashchenko // Shutterstock
#11. Disc jockeys, except radio
– Divorce rate: 25.0%
– Separation rate: 1.9%
– Average hourly wage: $21.82 ($6 lower than national average)
– Nationwide employment: 4,770
You may also like: How the gender wage gap has changed over the last 40 years

Akimov Igor // Shutterstock
#10. Furnace, kiln, oven, drier, and kettle operators and tenders
– Divorce rate: 25.0%
– Separation rate: 5.0%
– Average annual salary: $43,910 ($14,350 lower than national average)
– Nationwide employment: 14,180

Rawpixel.com // Shutterstock
#9. Orderlies and psychiatric aides
Nurse making the bed at a hospital.
– Divorce rate: 25.1%
– Separation rate: 4.0%
– Average annual salary: $34,040 ($24,220 lower than national average)
– Nationwide employment: 42,150

Standret // Shutterstock
#8. Entertainers and performers, sports and related workers, all other
– Divorce rate: 25.5%
– Separation rate: 4.9%
– Average hourly wage: $24.62 ($3 lower than national average)
– Nationwide employment: 8,300

Kzenon // Shutterstock
#7. Personal care aides
Two helpers helping senior woman in wheelchair into a car.
– Divorce rate: 25.8%
– Separation rate: 4.9%
– Average annual salary: $29,260 ($29,000 lower than national average)
– Nationwide employment: 3,366,480
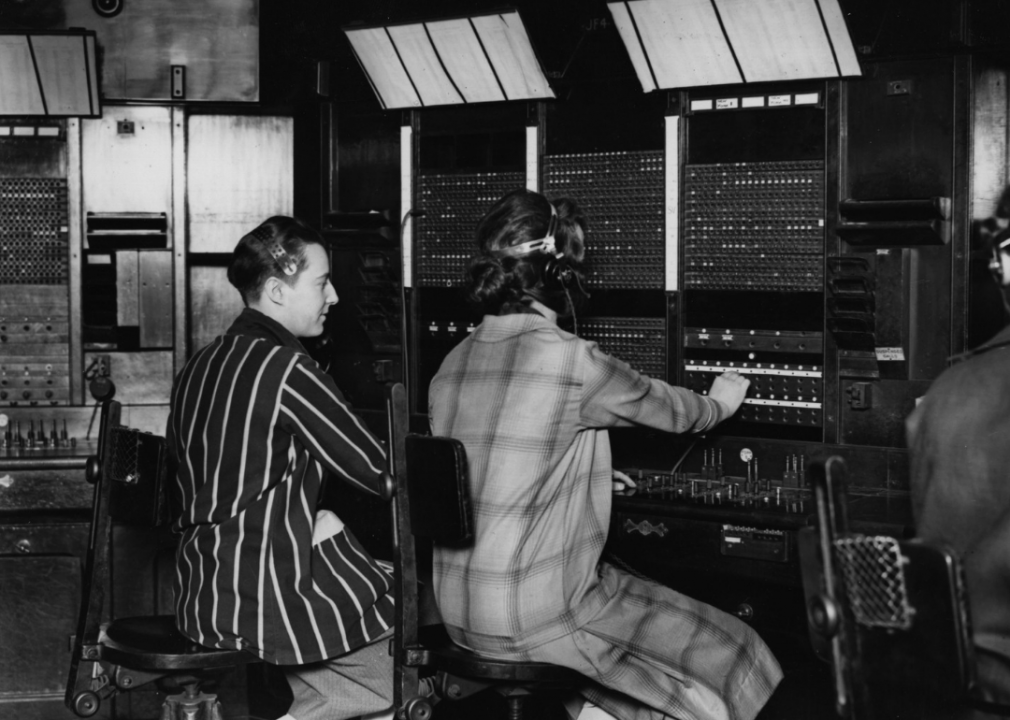
Topical Press Agency // Getty Images
#6. Telephone operators
– Divorce rate: 26.1%
– Separation rate: 1.3%
– Average annual salary: $39,370 ($18,890 lower than national average)
– Nationwide employment: 3,870
You may also like: The most important well-being programs, according to workers

ESB Basic // Shutterstock
#5. Switchboard operators, including answering service
Portrait of a smiling customer service representative at the computer.
– Divorce rate: 26.5%
– Separation rate: 1.6%
– Average annual salary: $34,590 ($23,670 lower than national average)
– Nationwide employment: 48,190

4 PM production // Shutterstock
#4. Flight attendants
– Divorce rate: 26.9%
– Separation rate: 0.9%
– Average annual salary: $62,280 ($4,020 higher than national average)
– Nationwide employment: 96,900

NDAB Creativity // Shutterstock
#3. Massage therapists
– Divorce rate: 27.1%
– Separation rate: 2.5%
– Average annual salary: $49,260 ($9,000 lower than national average)
– Nationwide employment: 81,030

Crew // Wikimedia Commons
#2. Bartenders
– Divorce rate: 28.2%
– Separation rate: 4.6%
– Average annual salary: $30,340 ($27,920 lower than national average)
– Nationwide employment: 485,330

Atstock Productions // Shutterstock
#1. Telemarketers
– Divorce rate: 31.7%
– Separation rate: 5.9%
– Average annual salary: $30,670 ($27,590 lower than national average)
– Nationwide employment: 115,130
You may also like: How the ‘Great Resignation’ has impacted 10 industries