Metros sending the most people to Kansas City

TommyBrison // Shutterstock
Metros sending the most people to Kansas City
compiled a list of metros that are sending the most people to Kansas City, MO-KS Metro Area using data from the U.S. Census Bureau. Metros are ranked by the estimated number of people who moved to Kansas City from the metro between 2015 and 2019. Ties were broken by gross migration.
You may also like: Where people in Kansas City are moving to most
![]()

Ben P L // Wikimedia Commons
#50. Provo-Orem, UT Metro Area
– Migration to Kansas City from Provo in 2015-2019: 317 (#14 most common destination from Provo)
– Migration from Kansas City to Provo: 236 (#61 most common destination from Kansas City)
– Net migration: 81 to Kansas City
Stuart Seeger // Wikicommons
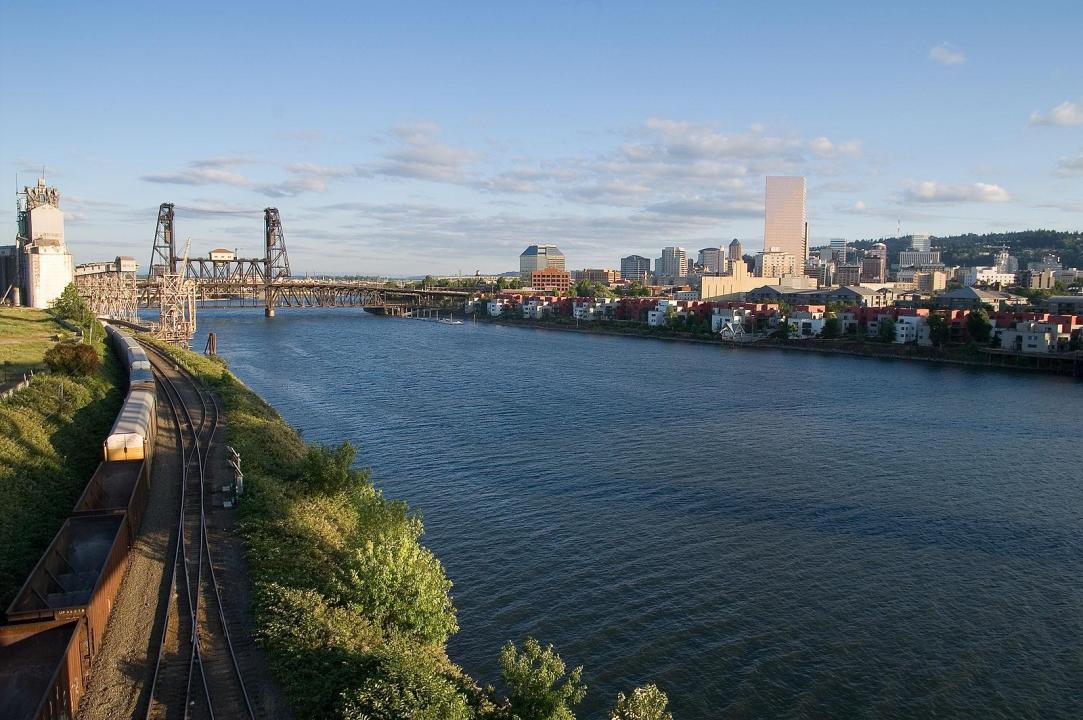
#49. Portland-Vancouver-Hillsboro, OR-WA Metro Area
– Migration to Kansas City from Portland in 2015-2019: 320 (#47 most common destination from Portland)
– Migration from Kansas City to Portland: 374 (#37 most common destination from Kansas City)
– Net migration: 54 to Portland
Famartin // Wikicommons
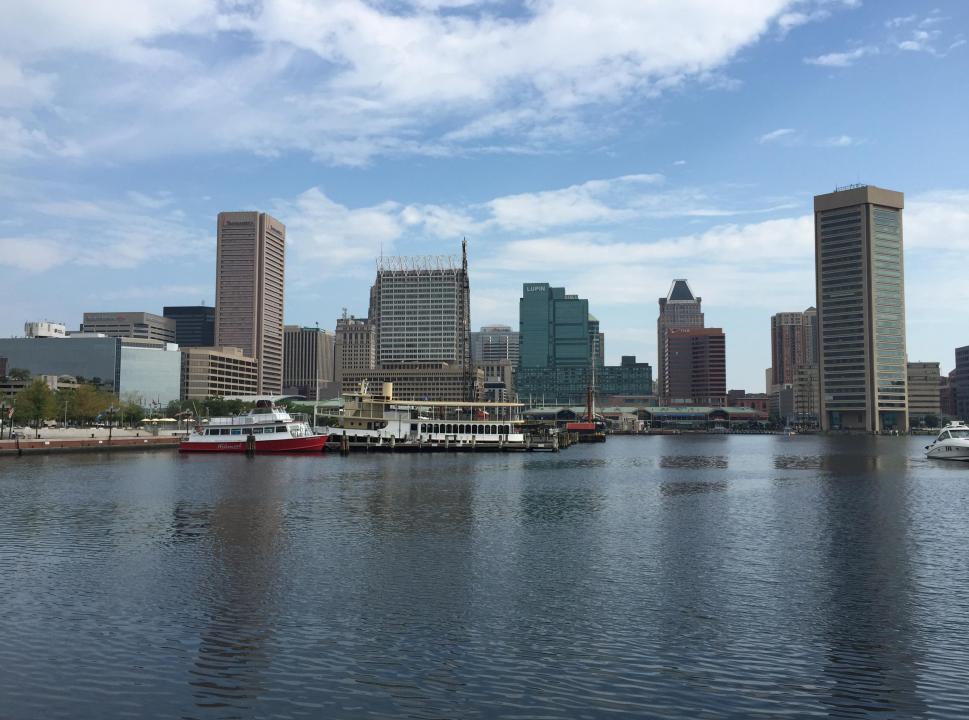
#48. Baltimore-Columbia-Towson, MD Metro Area
– Migration to Kansas City from Baltimore in 2015-2019: 322 (#58 most common destination from Baltimore)
– Migration from Kansas City to Baltimore: 81 (#114 most common destination from Kansas City)
– Net migration: 241 to Kansas City

JamesPatrick.pro // Shutterstock
#47. Davenport-Moline-Rock Island, IA-IL Metro Area
– Migration to Kansas City from Davenport in 2015-2019: 328 (#10 most common destination from Davenport)
– Migration from Kansas City to Davenport: 97 (#103 most common destination from Kansas City)
– Net migration: 231 to Kansas City
Sherry V Smith // Shutterstock
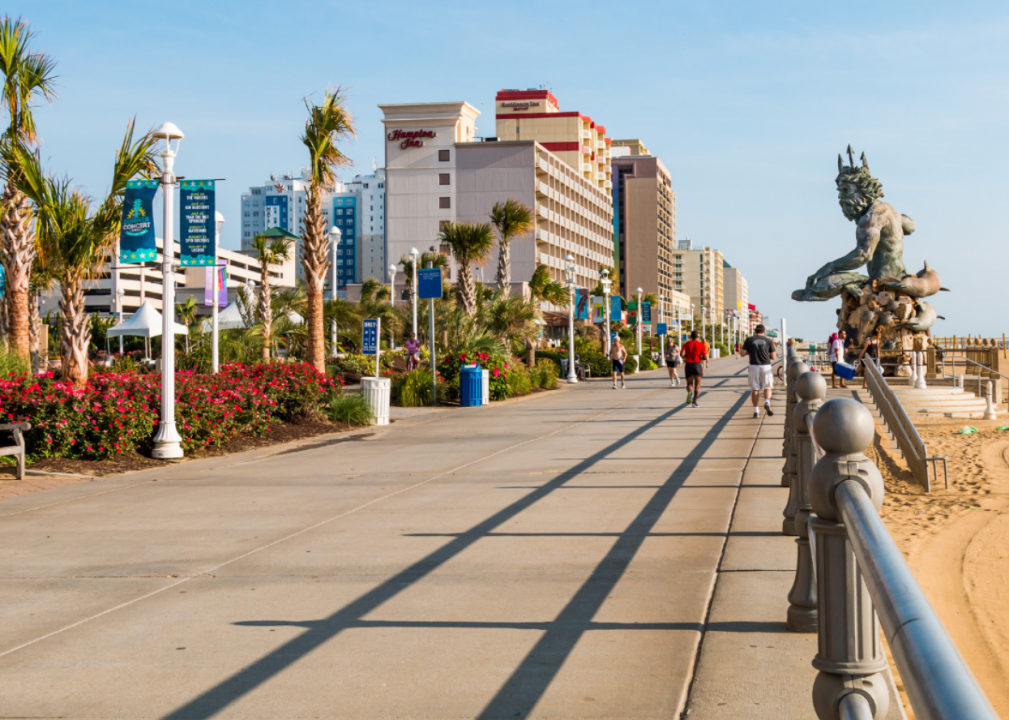
#46. Virginia Beach-Norfolk-Newport News, VA-NC Metro Area
– Migration to Kansas City from Virginia Beach in 2015-2019: 344 (#52 most common destination from Virginia Beach)
– Migration from Kansas City to Virginia Beach: 302 (#44 most common destination from Kansas City)
– Net migration: 42 to Kansas City
You may also like: Highest paying jobs that require a 2 year degree in Kansas City
David Wilson // Flickr
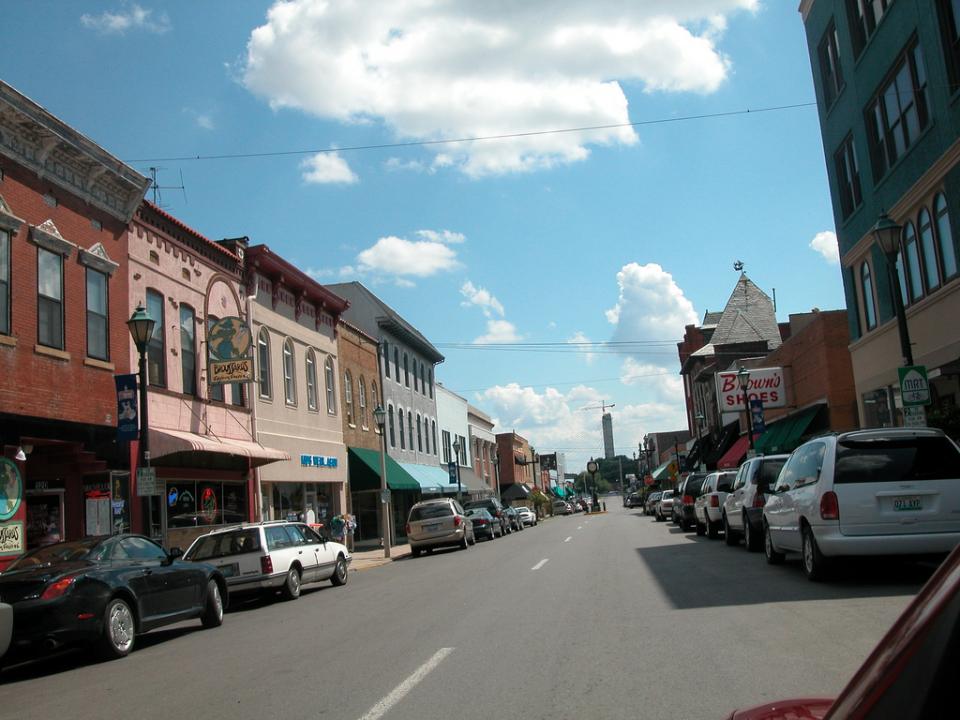
#45. Cape Girardeau, MO-IL Metro Area
– Migration to Kansas City from Cape Girardeau in 2015-2019: 345 (#3 most common destination from Cape Girardeau)
– Migration from Kansas City to Cape Girardeau: 167 (#75 most common destination from Kansas City)
– Net migration: 178 to Kansas City

Jason // Wikimedia Commons
#44. Poughkeepsie-Newburgh-Middletown, NY Metro Area
– Migration to Kansas City from Poughkeepsie in 2015-2019: 367 (#9 most common destination from Poughkeepsie)
– Migration from Kansas City to Poughkeepsie: 8 (#242 most common destination from Kansas City)
– Net migration: 359 to Kansas City
Alvesgaspar // Wikimedia
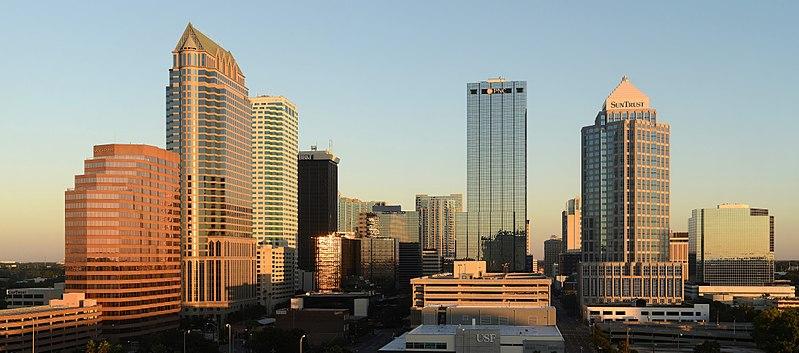
#43. Tampa-St. Petersburg-Clearwater, FL Metro Area
– Migration to Kansas City from Tampa in 2015-2019: 367 (#65 most common destination from Tampa)
– Migration from Kansas City to Tampa: 543 (#28 most common destination from Kansas City)
– Net migration: 176 to Tampa

Brandonrush // Wikicommons
#42. Fayetteville-Springdale-Rogers, AR Metro Area
– Migration to Kansas City from Fayetteville in 2015-2019: 376 (#8 most common destination from Fayetteville)
– Migration from Kansas City to Fayetteville: 650 (#22 most common destination from Kansas City)
– Net migration: 274 to Fayetteville

Wikimedia
#41. Oklahoma City, OK Metro Area
– Migration to Kansas City from Oklahoma City in 2015-2019: 399 (#20 most common destination from Oklahoma City)
– Migration from Kansas City to Oklahoma City: 885 (#19 most common destination from Kansas City)
– Net migration: 486 to Oklahoma City
You may also like: Highest-rated things to do in Kansas City, according to Tripadvisor

randy andy // Shutterstock
#40. Las Vegas-Henderson-Paradise, NV Metro Area
– Migration to Kansas City from Las Vegas in 2015-2019: 414 (#41 most common destination from Las Vegas)
– Migration from Kansas City to Las Vegas: 299 (#45 most common destination from Kansas City)
– Net migration: 115 to Kansas City
Tony Webster // Wikicommons
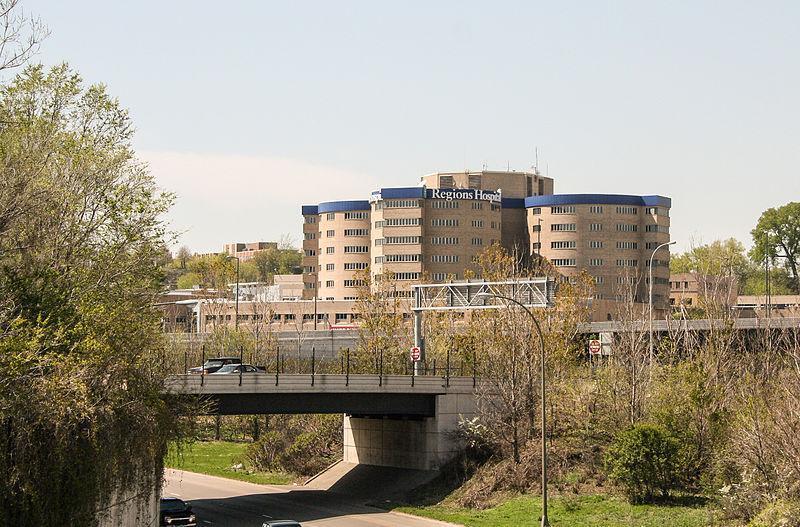
#39. Minneapolis-St. Paul-Bloomington, MN-WI Metro Area
– Migration to Kansas City from Minneapolis in 2015-2019: 414 (#48 most common destination from Minneapolis)
– Migration from Kansas City to Minneapolis: 1,120 (#12 most common destination from Kansas City)
– Net migration: 706 to Minneapolis

Sean Pavone // Shutterstock
#38. Boston-Cambridge-Newton, MA-NH Metro Area
– Migration to Kansas City from Boston in 2015-2019: 418 (#60 most common destination from Boston)
– Migration from Kansas City to Boston: 290 (#49 most common destination from Kansas City)
– Net migration: 128 to Kansas City
Max Pixel
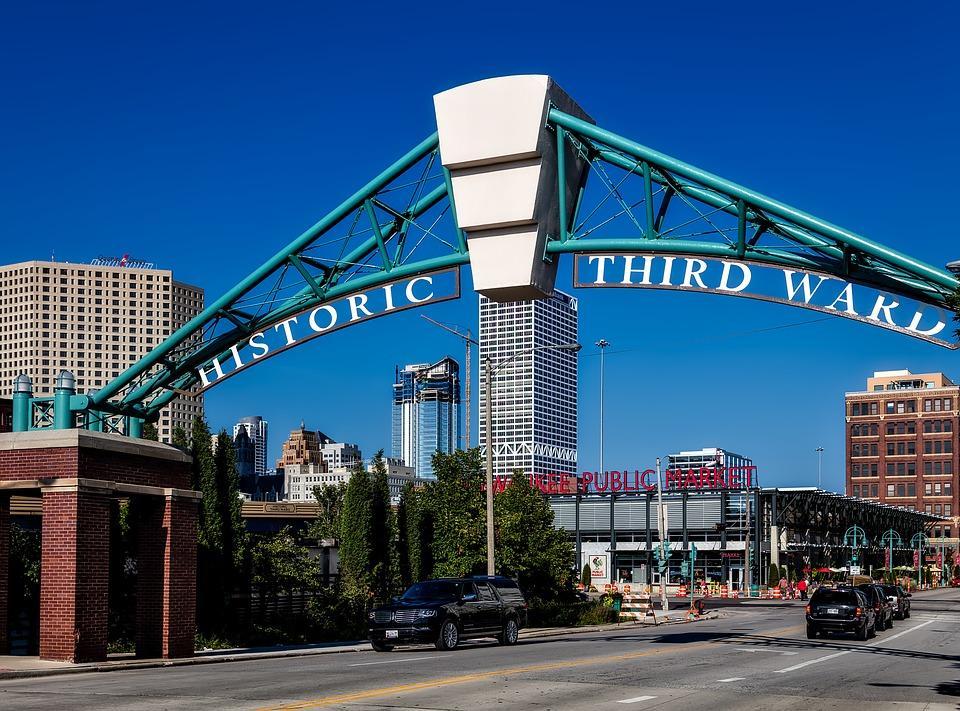
#37. Milwaukee-Waukesha, WI Metro Area
– Migration to Kansas City from Milwaukee in 2015-2019: 426 (#22 most common destination from Milwaukee)
– Migration from Kansas City to Milwaukee: 156 (#79 most common destination from Kansas City)
– Net migration: 270 to Kansas City
Noel Pennington//Flickr
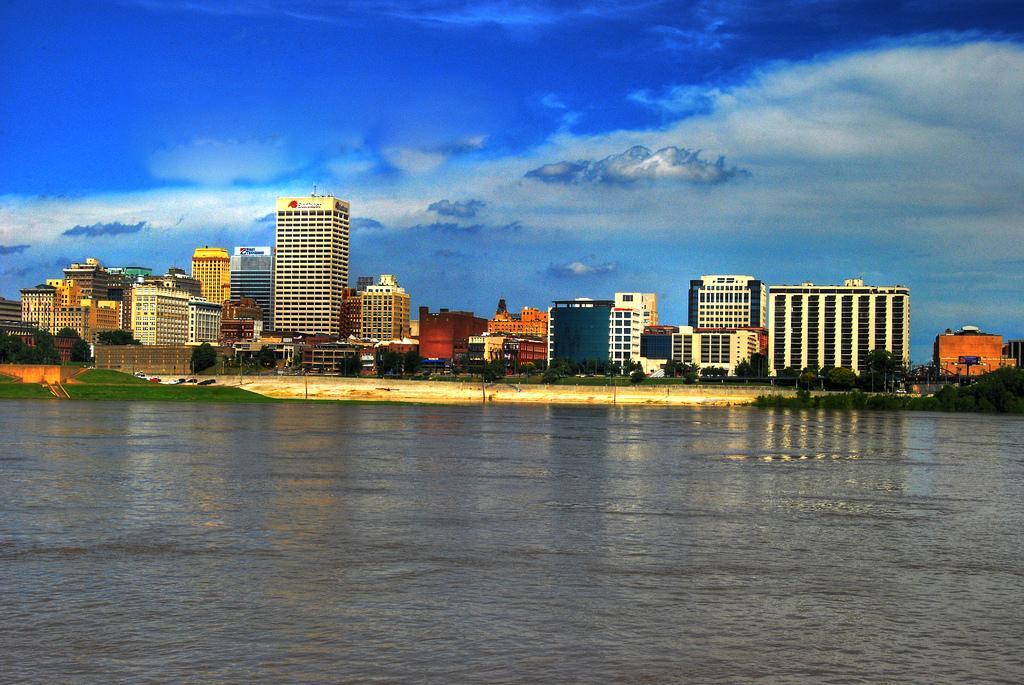
#36. Memphis, TN-MS-AR Metro Area
– Migration to Kansas City from Memphis in 2015-2019: 431 (#18 most common destination from Memphis)
– Migration from Kansas City to Memphis: 203 (#68 most common destination from Kansas City)
– Net migration: 228 to Kansas City
You may also like: Cities with the fastest growing home prices in Kansas City metro area

f11photo // Shutterstock
#35. Philadelphia-Camden-Wilmington, PA-NJ-DE-MD Metro Area
– Migration to Kansas City from Philadelphia in 2015-2019: 449 (#74 most common destination from Philadelphia)
– Migration from Kansas City to Philadelphia: 251 (#55 most common destination from Kansas City)
– Net migration: 198 to Kansas City

Katherine Dowler // Wikimedia
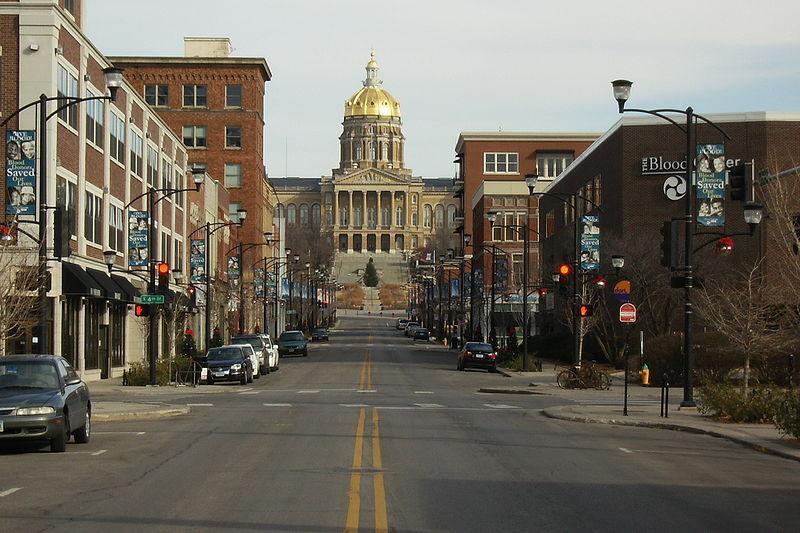
#34. Jefferson City, MO Metro Area
– Migration to Kansas City from Jefferson City in 2015-2019: 461 (#4 most common destination from Jefferson City)
– Migration from Kansas City to Jefferson City: 1,237 (#11 most common destination from Kansas City)
– Net migration: 776 to Jefferson City

f11photo // Shutterstock
#33. Nashville-Davidson–Murfreesboro–Franklin, TN Metro Area
– Migration to Kansas City from Nashville in 2015-2019: 473 (#28 most common destination from Nashville)
– Migration from Kansas City to Nashville: 547 (#27 most common destination from Kansas City)
– Net migration: 74 to Nashville
en:User:Paul.h // Wikimedia
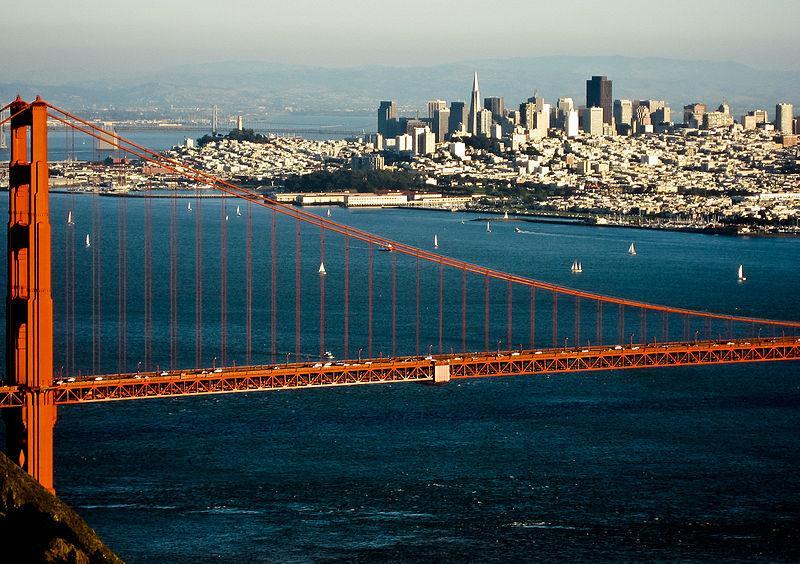
#32. San Francisco-Oakland-Berkeley, CA Metro Area
– Migration to Kansas City from San Francisco in 2015-2019: 480 (#54 most common destination from San Francisco)
– Migration from Kansas City to San Francisco: 473 (#32 most common destination from Kansas City)
– Net migration: 7 to Kansas City

PhotosByMahin // Pixabay
#31. Detroit-Warren-Dearborn, MI Metro Area
– Migration to Kansas City from Detroit in 2015-2019: 496 (#43 most common destination from Detroit)
– Migration from Kansas City to Detroit: 341 (#41 most common destination from Kansas City)
– Net migration: 155 to Kansas City
You may also like: Closest national parks to Kansas City

SD Dirk // Flickr
#30. San Diego-Chula Vista-Carlsbad, CA Metro Area
– Migration to Kansas City from San Diego in 2015-2019: 497 (#57 most common destination from San Diego)
– Migration from Kansas City to San Diego: 502 (#30 most common destination from Kansas City)
– Net migration: 5 to San Diego
Pixabay
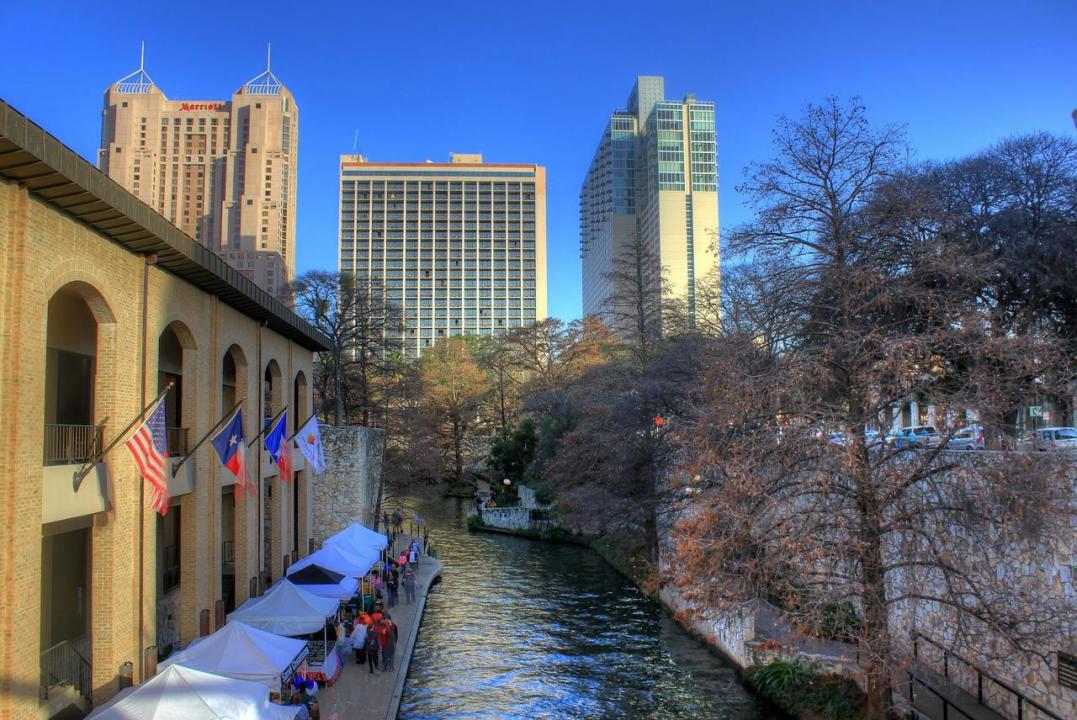
#29. San Antonio-New Braunfels, TX Metro Area
– Migration to Kansas City from San Antonio in 2015-2019: 503 (#36 most common destination from San Antonio)
– Migration from Kansas City to San Antonio: 295 (#48 most common destination from Kansas City)
– Net migration: 208 to Kansas City

Katherine Welles // Shutterstock
#28. Lincoln, NE Metro Area
– Migration to Kansas City from Lincoln in 2015-2019: 520 (#2 most common destination from Lincoln)
– Migration from Kansas City to Lincoln: 296 (#47 most common destination from Kansas City)
– Net migration: 224 to Kansas City
AbeEzekowitz // Wikimedia Commons
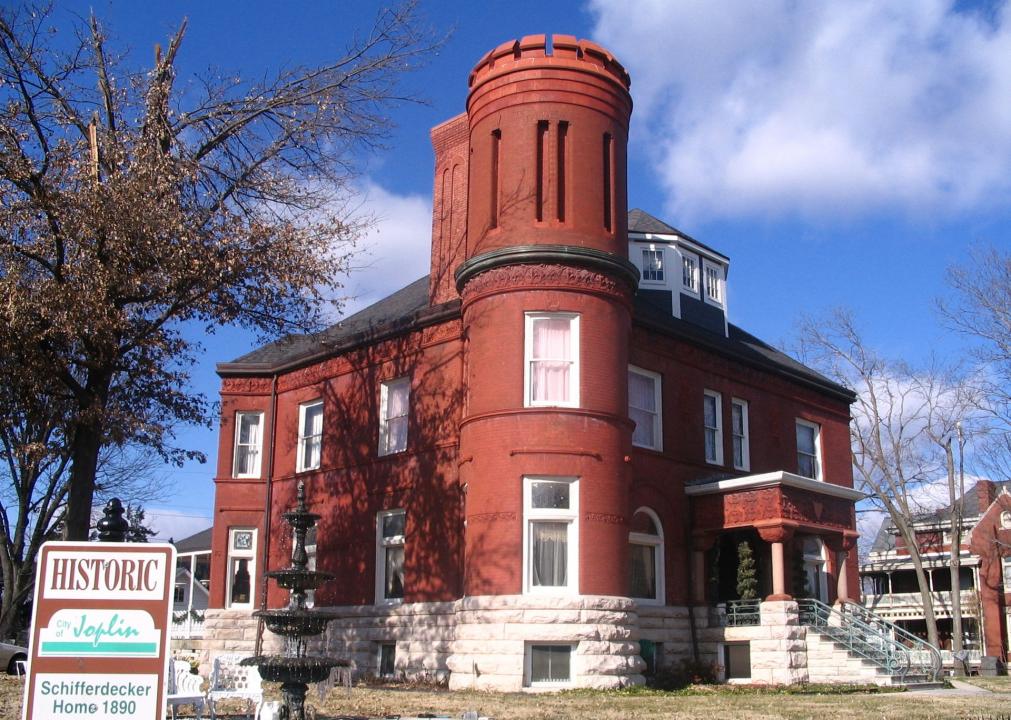
#27. Joplin, MO Metro Area
– Migration to Kansas City from Joplin in 2015-2019: 553 (#2 most common destination from Joplin)
– Migration from Kansas City to Joplin: 930 (#17 most common destination from Kansas City)
– Net migration: 377 to Joplin
Kolossos // Wikimedia Commons
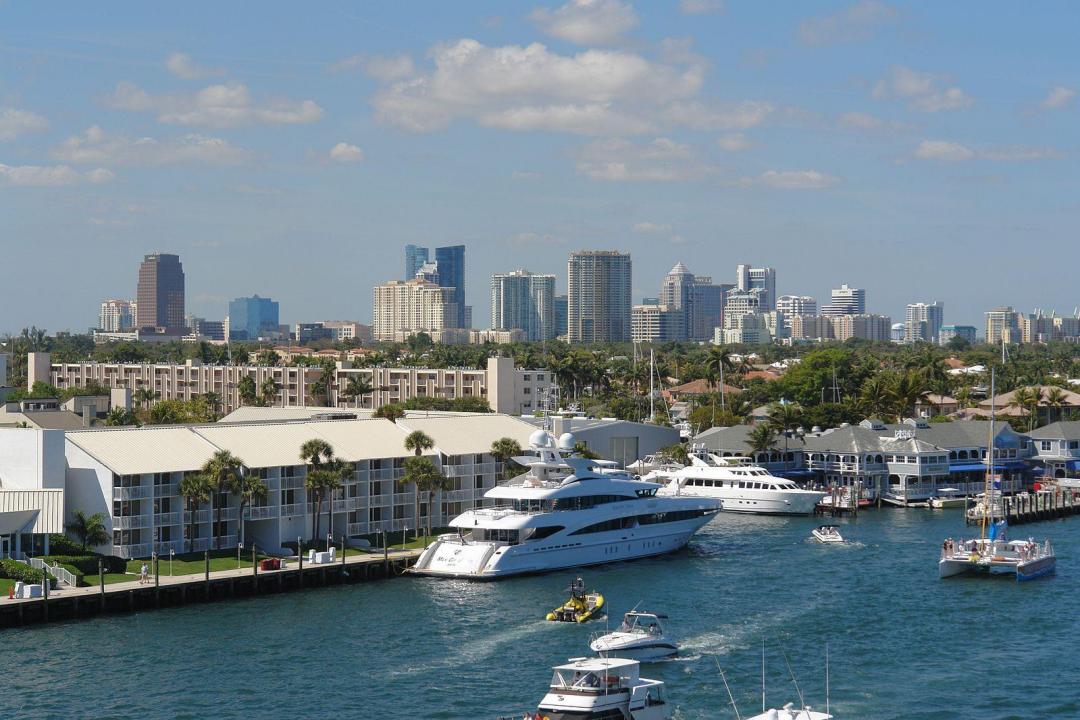
#26. Miami-Fort Lauderdale-Pompano Beach, FL Metro Area
– Migration to Kansas City from Miami in 2015-2019: 583 (#54 most common destination from Miami)
– Migration from Kansas City to Miami: 248 (#56 most common destination from Kansas City)
– Net migration: 335 to Kansas City
You may also like: Highest and lowest paying education jobs in Kansas City

Sean Pavone // Shutterstock
#25. Indianapolis-Carmel-Anderson, IN Metro Area
– Migration to Kansas City from Indianapolis in 2015-2019: 592 (#25 most common destination from Indianapolis)
– Migration from Kansas City to Indianapolis: 358 (#40 most common destination from Kansas City)
– Net migration: 234 to Kansas City

Caleb Long // Wikimedia
#24. Tulsa, OK Metro Area
– Migration to Kansas City from Tulsa in 2015-2019: 604 (#9 most common destination from Tulsa)
– Migration from Kansas City to Tulsa: 560 (#26 most common destination from Kansas City)
– Net migration: 44 to Kansas City
lowahwyman // Wikimedia Commons
#23. Des Moines-West Des Moines, IA Metro Area
– Migration to Kansas City from Des Moines in 2015-2019: 616 (#7 most common destination from Des Moines)
– Migration from Kansas City to Des Moines: 454 (#33 most common destination from Kansas City)
– Net migration: 162 to Kansas City
Daniel Orth // Flickr
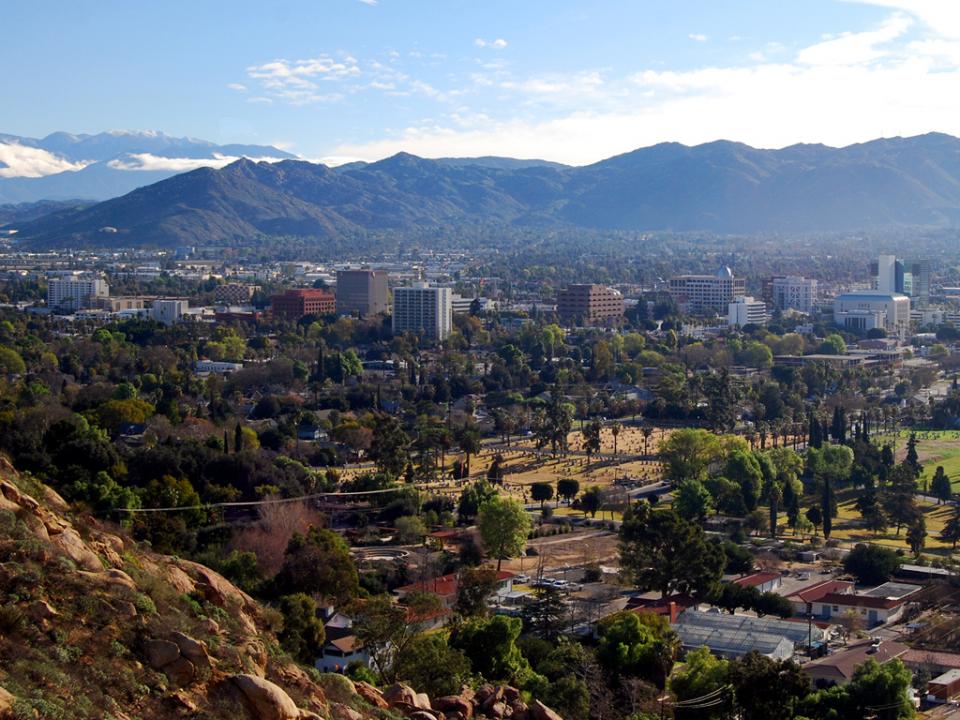
#22. Riverside-San Bernardino-Ontario, CA Metro Area
– Migration to Kansas City from Riverside in 2015-2019: 625 (#36 most common destination from Riverside)
– Migration from Kansas City to Riverside: 225 (#62 most common destination from Kansas City)
– Net migration: 400 to Kansas City

Sean Pavone // Shutterstock
#21. Columbus, OH Metro Area
– Migration to Kansas City from Columbus in 2015-2019: 655 (#19 most common destination from Columbus)
– Migration from Kansas City to Columbus: 400 (#35 most common destination from Kansas City)
– Net migration: 255 to Kansas City
You may also like: Highest-rated Mexican restaurants in Kansas City, according to Tripadvisor
Public Domain
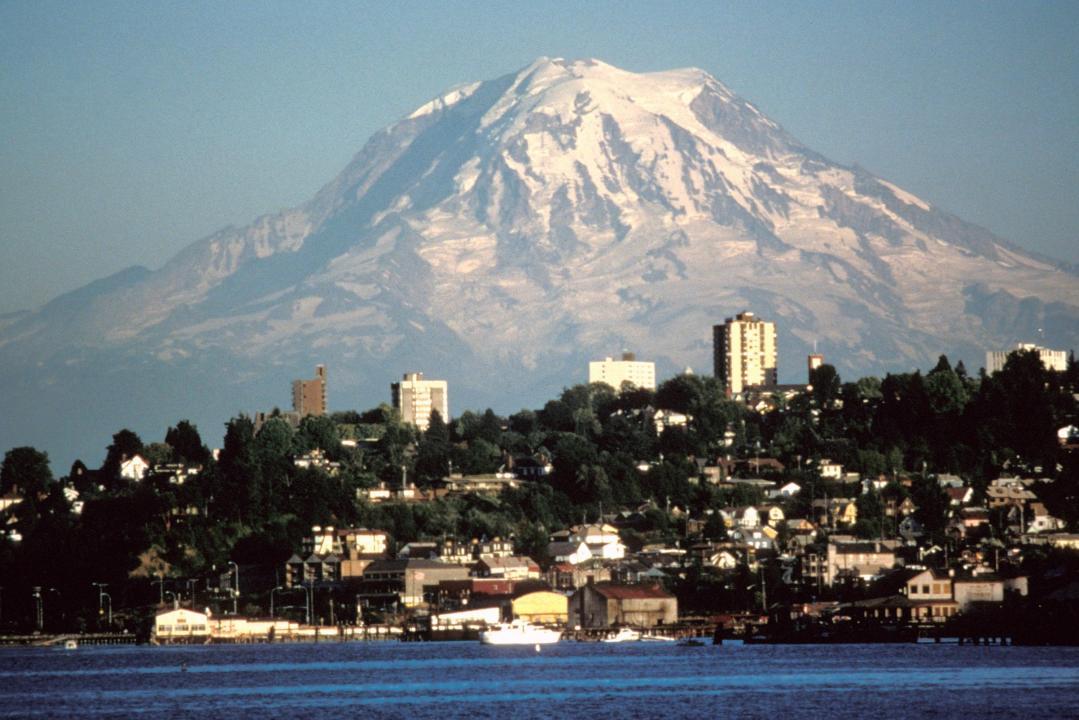
#20. Seattle-Tacoma-Bellevue, WA Metro Area
– Migration to Kansas City from Seattle in 2015-2019: 710 (#41 most common destination from Seattle)
– Migration from Kansas City to Seattle: 582 (#25 most common destination from Kansas City)
– Net migration: 128 to Kansas City

Keizers // Wikimedia Commons
#19. Atlanta-Sandy Springs-Alpharetta, GA Metro Area
– Migration to Kansas City from Atlanta in 2015-2019: 733 (#58 most common destination from Atlanta)
– Migration from Kansas City to Atlanta: 623 (#23 most common destination from Kansas City)
– Net migration: 110 to Kansas City

Robert Corby // Wikimedia Commons
#18. Colorado Springs, CO Metro Area
– Migration to Kansas City from Colorado Springs in 2015-2019: 903 (#11 most common destination from Colorado Springs)
– Migration from Kansas City to Colorado Springs: 984 (#15 most common destination from Kansas City)
– Net migration: 81 to Colorado Springs

King of Hearts // Wikimedia
#17. New York-Newark-Jersey City, NY-NJ-PA Metro Area
– Migration to Kansas City from New York in 2015-2019: 935 (#89 most common destination from New York)
– Migration from Kansas City to New York: 527 (#29 most common destination from Kansas City)
– Net migration: 408 to Kansas City

Andrew Bossi // Wikimedia
#16. Washington-Arlington-Alexandria, DC-VA-MD-WV Metro Area
– Migration to Kansas City from Washington in 2015-2019: 961 (#56 most common destination from Washington)
– Migration from Kansas City to Washington: 791 (#20 most common destination from Kansas City)
– Net migration: 170 to Kansas City
You may also like: Zip codes with the most expensive rent in Kansas City
BDS2006 // Wikimedia
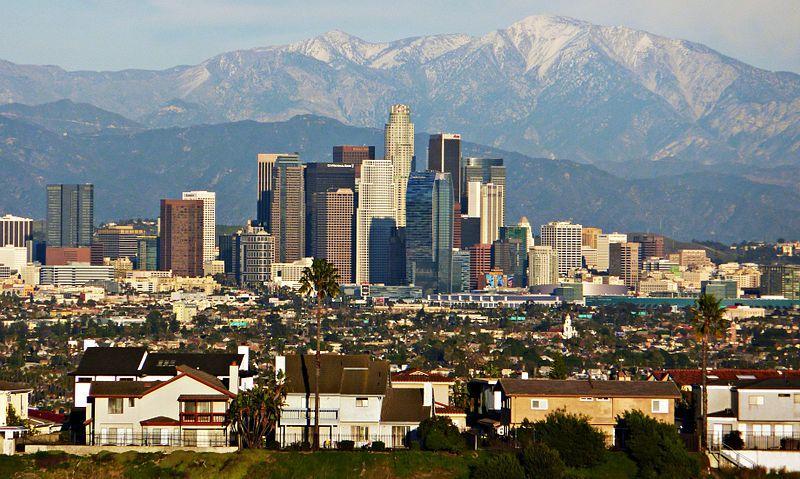
#15. Los Angeles-Long Beach-Anaheim, CA Metro Area
– Migration to Kansas City from Los Angeles in 2015-2019: 972 (#55 most common destination from Los Angeles)
– Migration from Kansas City to Los Angeles: 781 (#21 most common destination from Kansas City)
– Net migration: 191 to Kansas City
skeeze // Pixabay
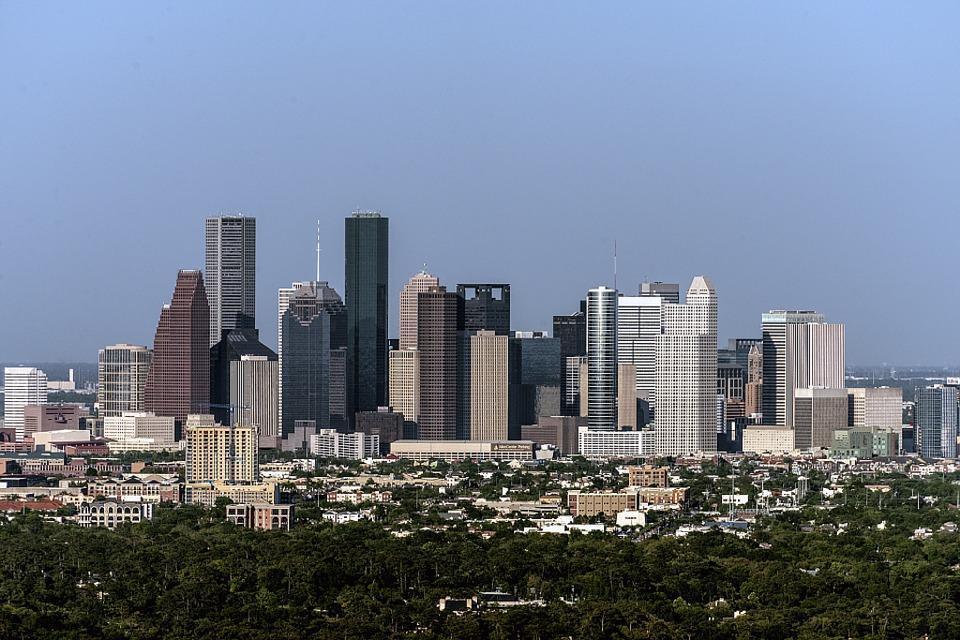
#14. Houston-The Woodlands-Sugar Land, TX Metro Area
– Migration to Kansas City from Houston in 2015-2019: 1,013 (#30 most common destination from Houston)
– Migration from Kansas City to Houston: 972 (#16 most common destination from Kansas City)
– Net migration: 41 to Kansas City

f11photo // Shutterstock
#13. Denver-Aurora-Lakewood, CO Metro Area
– Migration to Kansas City from Denver in 2015-2019: 1,173 (#21 most common destination from Denver)
– Migration from Kansas City to Denver: 1,455 (#8 most common destination from Kansas City)
– Net migration: 282 to Denver

DPPed// Wikimedia
#12. Phoenix-Mesa-Chandler, AZ Metro Area
– Migration to Kansas City from Phoenix in 2015-2019: 1,192 (#24 most common destination from Phoenix)
– Migration from Kansas City to Phoenix: 1,342 (#9 most common destination from Kansas City)
– Net migration: 150 to Phoenix

Alan Botting // Wikimedia Commons
#11. Dallas-Fort Worth-Arlington, TX Metro Area
– Migration to Kansas City from Dallas in 2015-2019: 1,195 (#32 most common destination from Dallas)
– Migration from Kansas City to Dallas: 2,686 (#3 most common destination from Kansas City)
– Net migration: 1,491 to Dallas
You may also like: Highest-rated restaurants in Kansas City, according to Tripadvisor

Christopher & Amy Esposito // Wikicommons
#10. Chicago-Naperville-Elgin, IL-IN-WI Metro Area
– Migration to Kansas City from Chicago in 2015-2019: 1,218 (#51 most common destination from Chicago)
– Migration from Kansas City to Chicago: 1,042 (#14 most common destination from Kansas City)
– Net migration: 176 to Kansas City
JonClee86 // Wikicommons
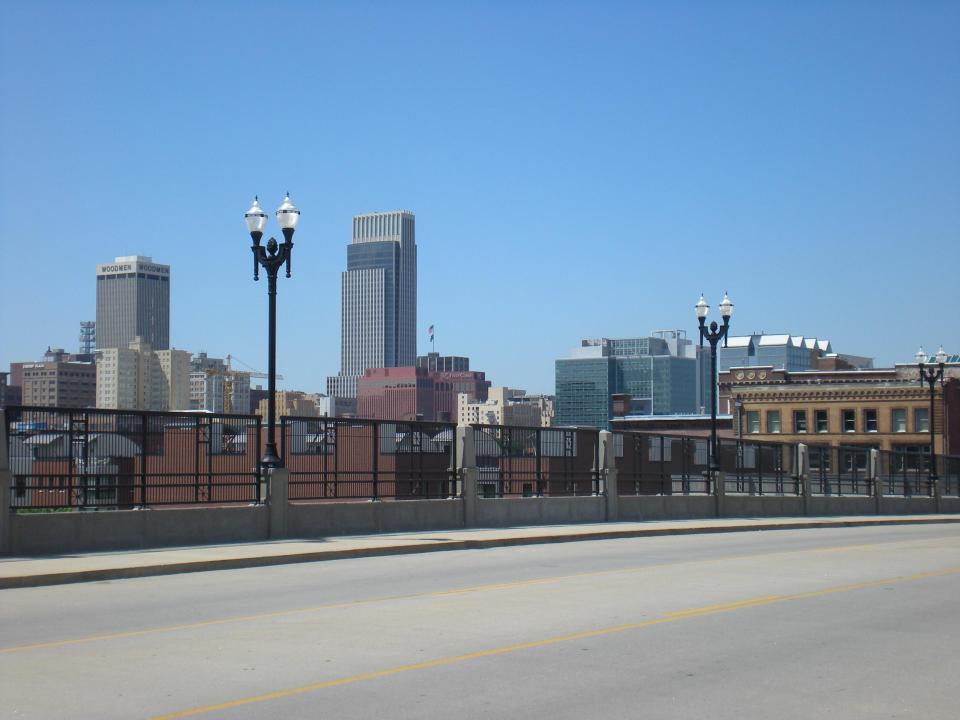
#9. Omaha-Council Bluffs, NE-IA Metro Area
– Migration to Kansas City from Omaha in 2015-2019: 1,250 (#2 most common destination from Omaha)
– Migration from Kansas City to Omaha: 902 (#18 most common destination from Kansas City)
– Net migration: 348 to Kansas City
Kzollman // Wikimedia Commons
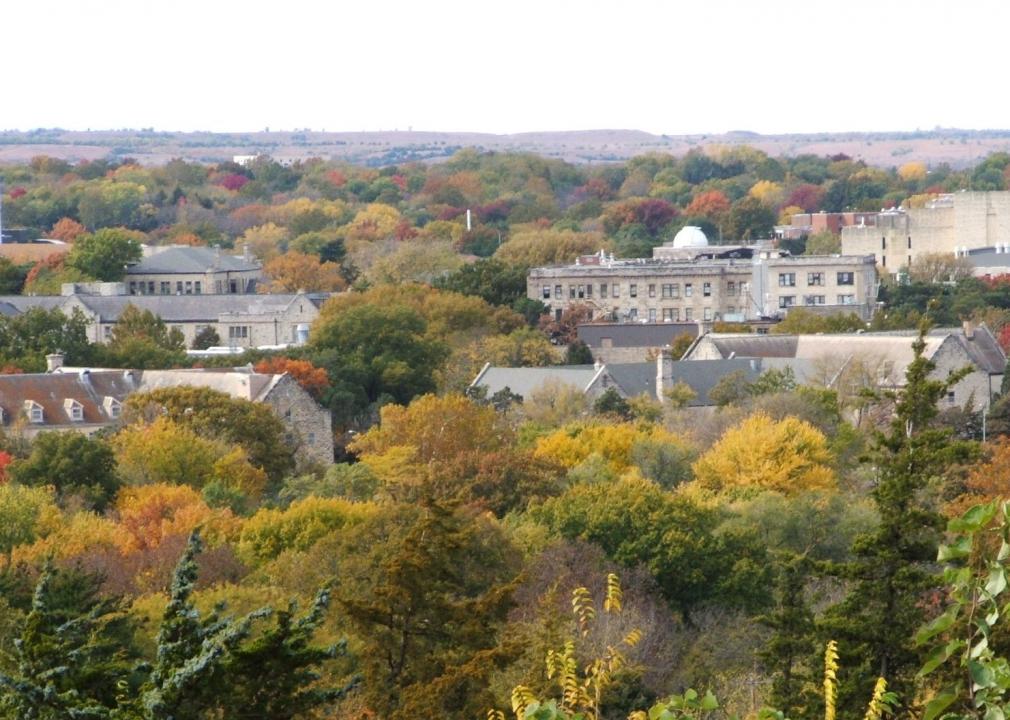
#8. Manhattan, KS Metro Area
– Migration to Kansas City from Manhattan in 2015-2019: 1,661 (#1 most common destination from Manhattan)
– Migration from Kansas City to Manhattan: 1,773 (#7 most common destination from Kansas City)
– Net migration: 112 to Manhattan
Tim Kiser // Wikimedia
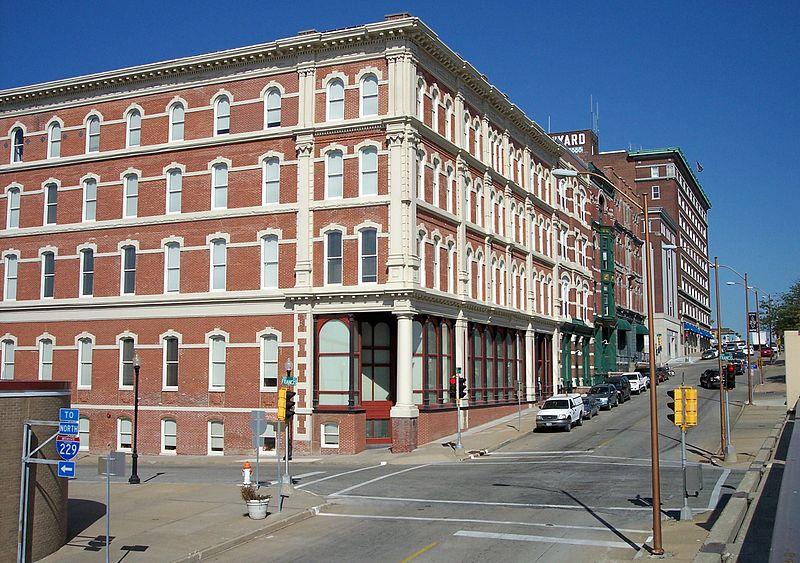
#7. St. Joseph, MO-KS Metro Area
– Migration to Kansas City from St. Joseph in 2015-2019: 1,834 (#1 most common destination from St. Joseph)
– Migration from Kansas City to St. Joseph: 2,456 (#5 most common destination from Kansas City)
– Net migration: 622 to St. Joseph
Pixabay
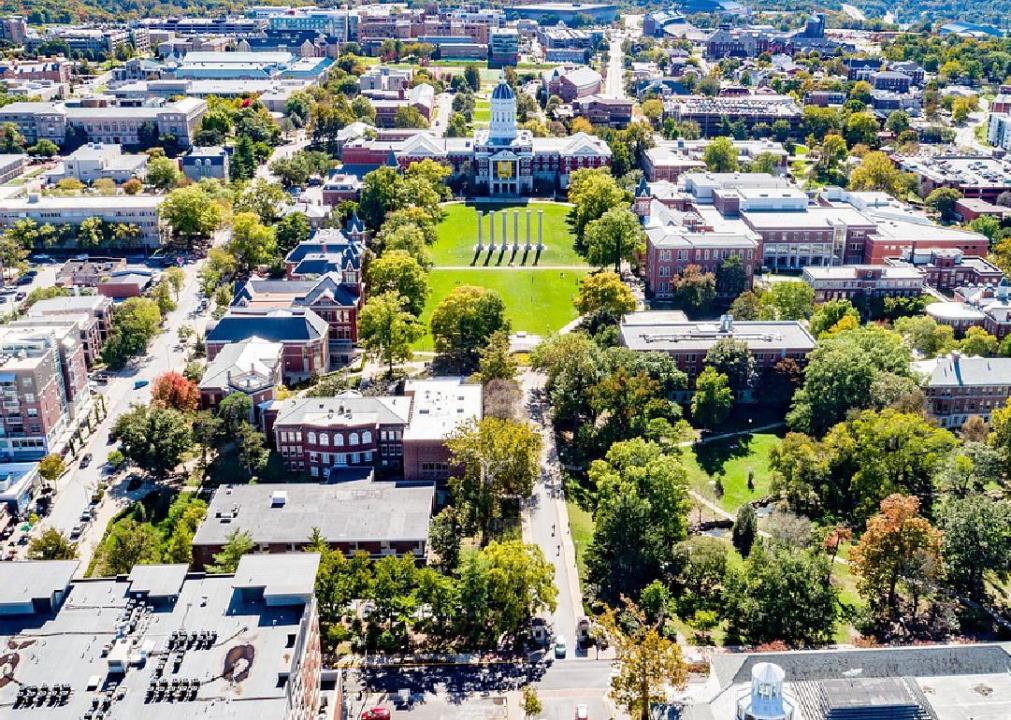
#6. Columbia, MO Metro Area
– Migration to Kansas City from Columbia in 2015-2019: 1,908 (#2 most common destination from Columbia)
– Migration from Kansas City to Columbia: 1,992 (#6 most common destination from Kansas City)
– Net migration: 84 to Columbia
You may also like: Highest-rated dessert shops in Kansas City, according to Tripadvisor

America’s Power // Wikicommons
#5. Topeka, KS Metro Area
– Migration to Kansas City from Topeka in 2015-2019: 2,490 (#1 most common destination from Topeka)
– Migration from Kansas City to Topeka: 1,115 (#13 most common destination from Kansas City)
– Net migration: 1,375 to Kansas City

Kristin Nador // Flickr
#4. Wichita, KS Metro Area
– Migration to Kansas City from Wichita in 2015-2019: 2,568 (#1 most common destination from Wichita)
– Migration from Kansas City to Wichita: 1,327 (#10 most common destination from Kansas City)
– Net migration: 1,241 to Kansas City
Jose Kevo // Wikicommons
#3. Springfield, MO Metro Area
– Migration to Kansas City from Springfield in 2015-2019: 2,569 (#1 most common destination from Springfield)
– Migration from Kansas City to Springfield: 2,518 (#4 most common destination from Kansas City)
– Net migration: 51 to Kansas City

Sean Pavone // Shutterstock
#2. St. Louis, MO-IL Metro Area
– Migration to Kansas City from St. Louis in 2015-2019: 2,629 (#5 most common destination from St. Louis)
– Migration from Kansas City to St. Louis: 3,540 (#2 most common destination from Kansas City)
– Net migration: 911 to St. Louis
Quasselkasper // Wikimedia
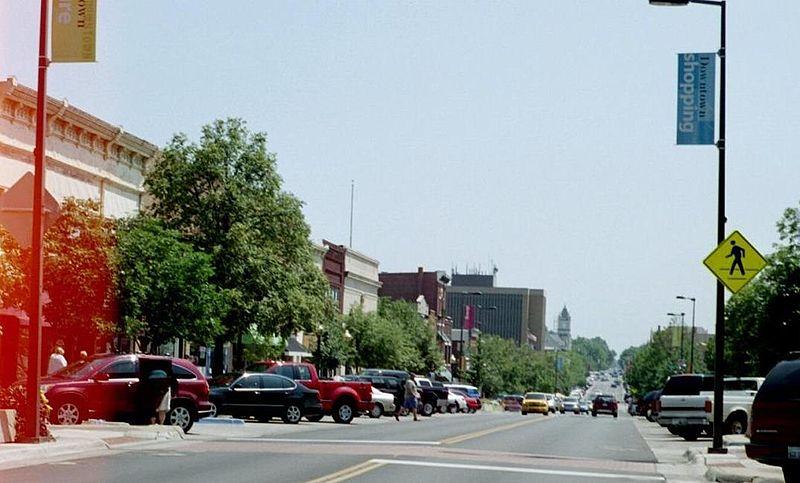
#1. Lawrence, KS Metro Area
– Migration to Kansas City from Lawrence in 2015-2019: 3,487 (#1 most common destination from Lawrence)
– Migration from Kansas City to Lawrence: 4,766 (#1 most common destination from Kansas City)
– Net migration: 1,279 to Lawrence
You may also like: Highest-paying jobs in Kansas City that don’t require a college degree