New Boone County online COVID-19 hub offers more data
COLUMBIA, Mo. (KMIZ)
Columbia and Boone County leaders unveiled a new online hub for COVID-19 information Tuesday morning.
In addition to the Boone County case numbers that are posted on the Columbia/Boone County Health Department's COVID-19 site, the new web page includes data on hospitalization, cases by zip code, rolling averages and cases in nearby counties.
Watch a replay of the news conference the media player below.
The new online hub has nine tabs with information varying from a COVID-19 glossary, case statistics, statistics charts, cases by zip code, cases by catchment counties, hospital status, COVID-19 information page, City of Columbia press releases and frequently asked questions.
Mayor Treece said this new hub helps the private sector, the community, concerned families and individuals manage by looking at the data and being able to see what goes into the difficult decisions that are being made.
"While there may be no right answer," Treece said. "There are clearly wrong answers and I think we are fortunate that because of the early efforts and because of that first stay at home order, we're experiencing the results that we all want."
City officials said the data contained in these tabs is updated every weekday by 5 p.m.
The first tab is a COVID-19 glossary that has definitions of commonly used terms that have been used during the pandemic.
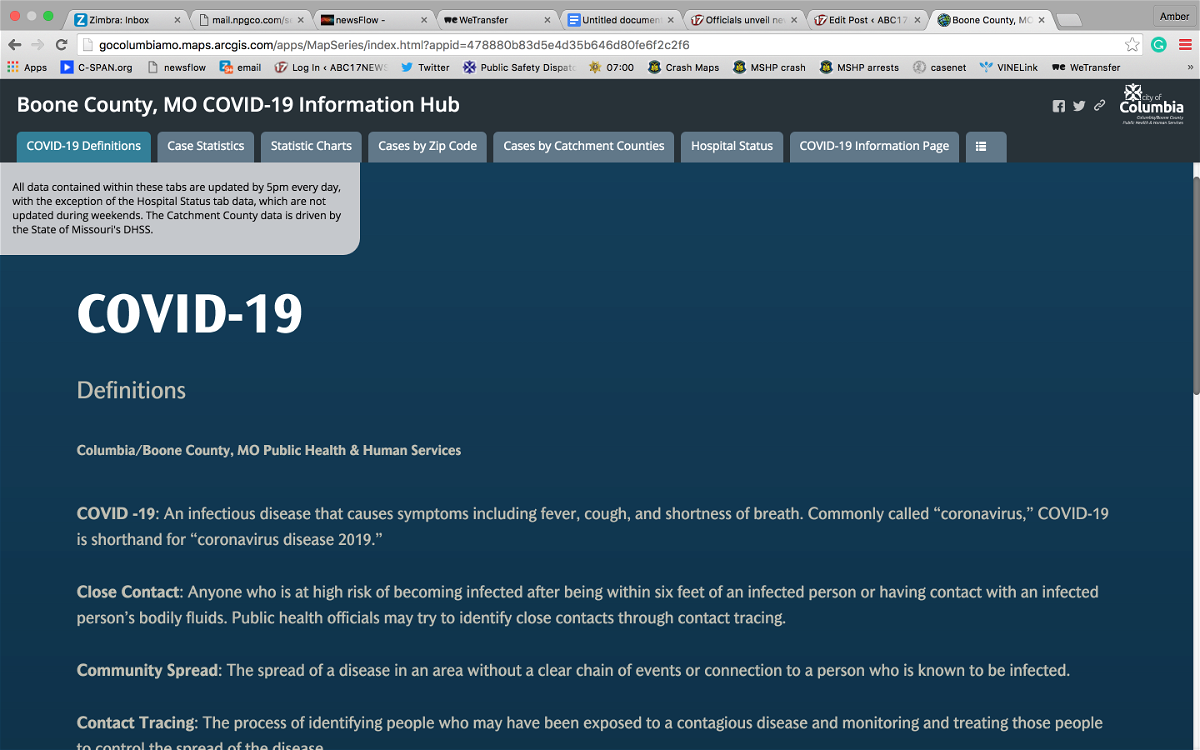
City officials said these terms are important to understanding the data in the hub.
Some of the terms explained are isolation, quarantine and ventilators.
The second tab shows case statistics that were already listed on the main site but are now displayed differently.
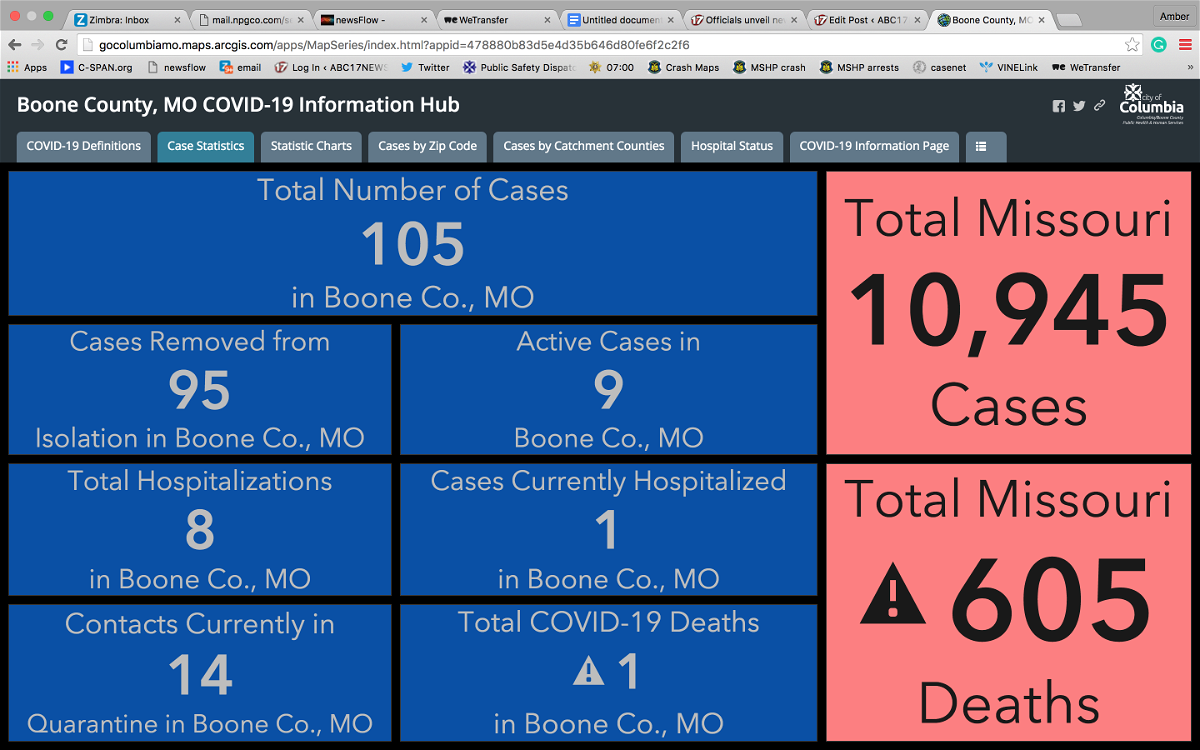
The case statistics show how many total cases have occurred in Boone County, how many active cases remain, how many have been removed from isolation, how many people are in the hospital, how many people are in quarantine and how many people have died because of COVID-19 in Boone County.
The second tab aslo includes Missouri's total cases and deaths from COVID-19.
The third tab includes many charts and graphs of data that have not been shared with the public in this way before.
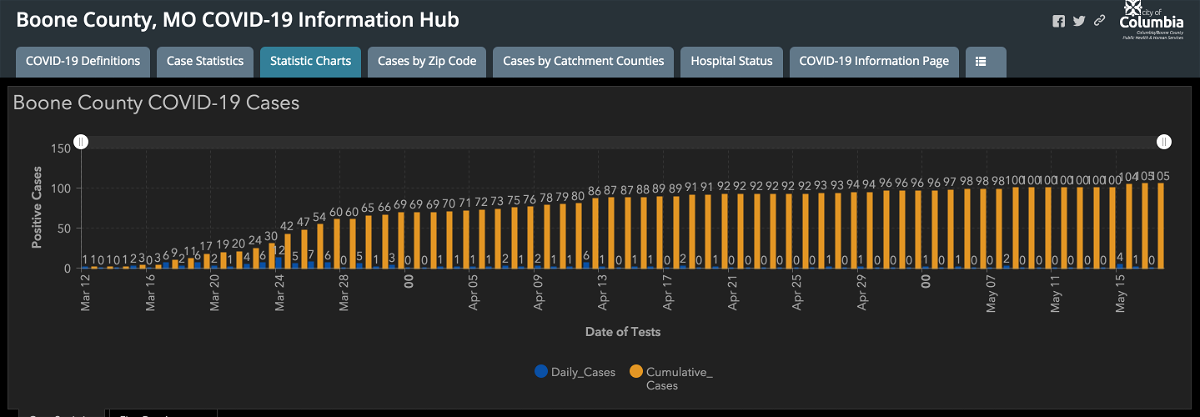
The first chart shows the cumulative number of cases as those numbers increase over time and the numbers of new cases, each day.
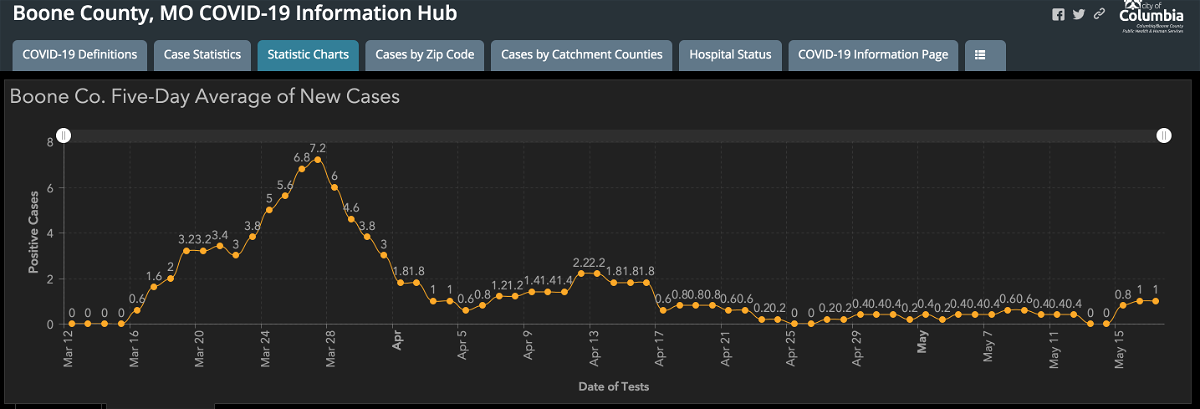
There's also a tab for a graph that looks at a five-day average of new cases. City officials said this is a method that is being used across the country and that it smooths out the cases over time and allows health officials to have a better idea of how many cases Boone County and other counties may be working on at any particular time.
City officials said they had a suggestion to make a seven-day rolling average graph, but officials said they went with a five-day average graph to mimic what Johns Hopkins University is using on its dashboard so people are able to compare the data.
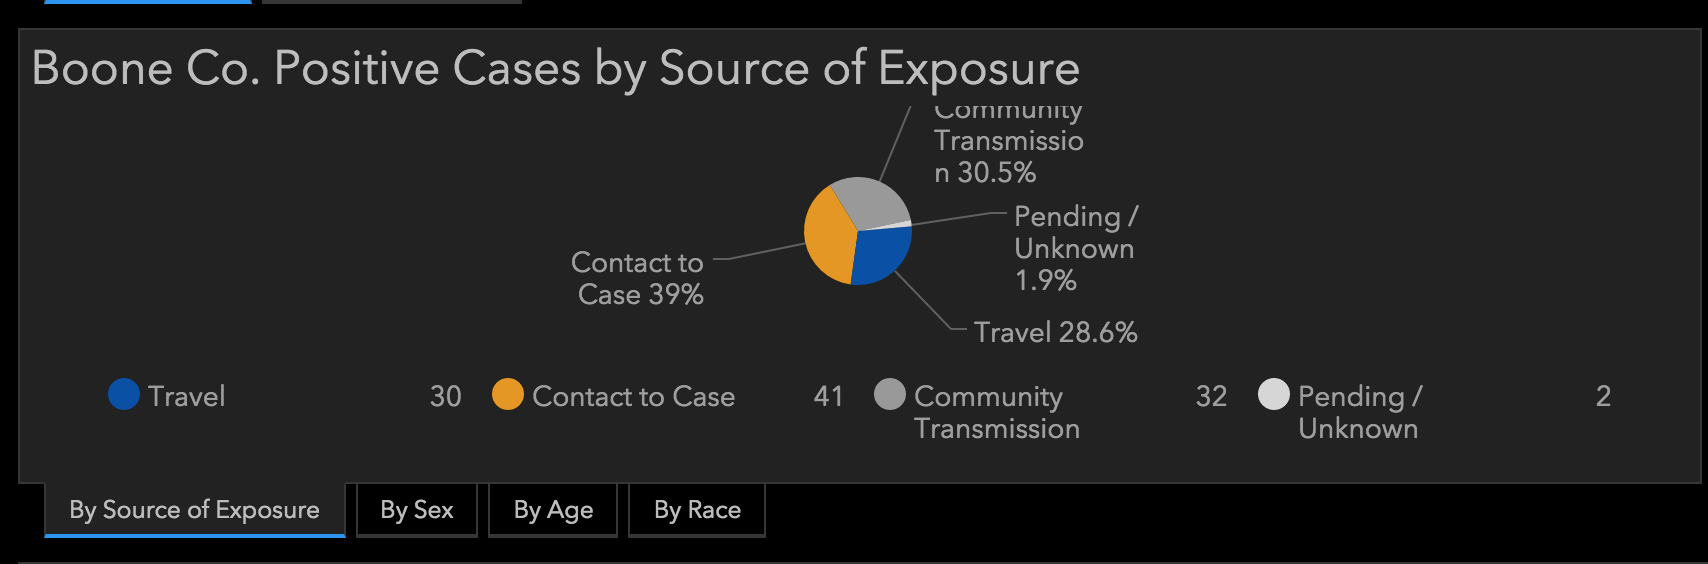
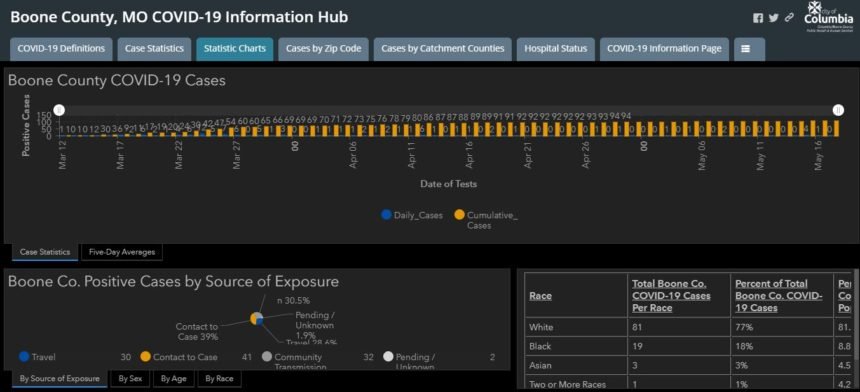
One of the graphs on tab three looks at the data by source of exposure. The graph allows people to hover over the areas and see the numbers in real time.
The graph also provides options for information about the cases by sex, age and race.
The last chart on tab three shows the distribution by race and tells health officials what the racial distribution is for all the cases.
City officials said Boone County is seeing more cases in the black community -- 18% of Boone County cases are in the black population, which makes up only 8.8% of the Boone County population.
Tab four is a map that contains data from cases by zip code.
City officials said this is new and it's something that they've not been able to display before.
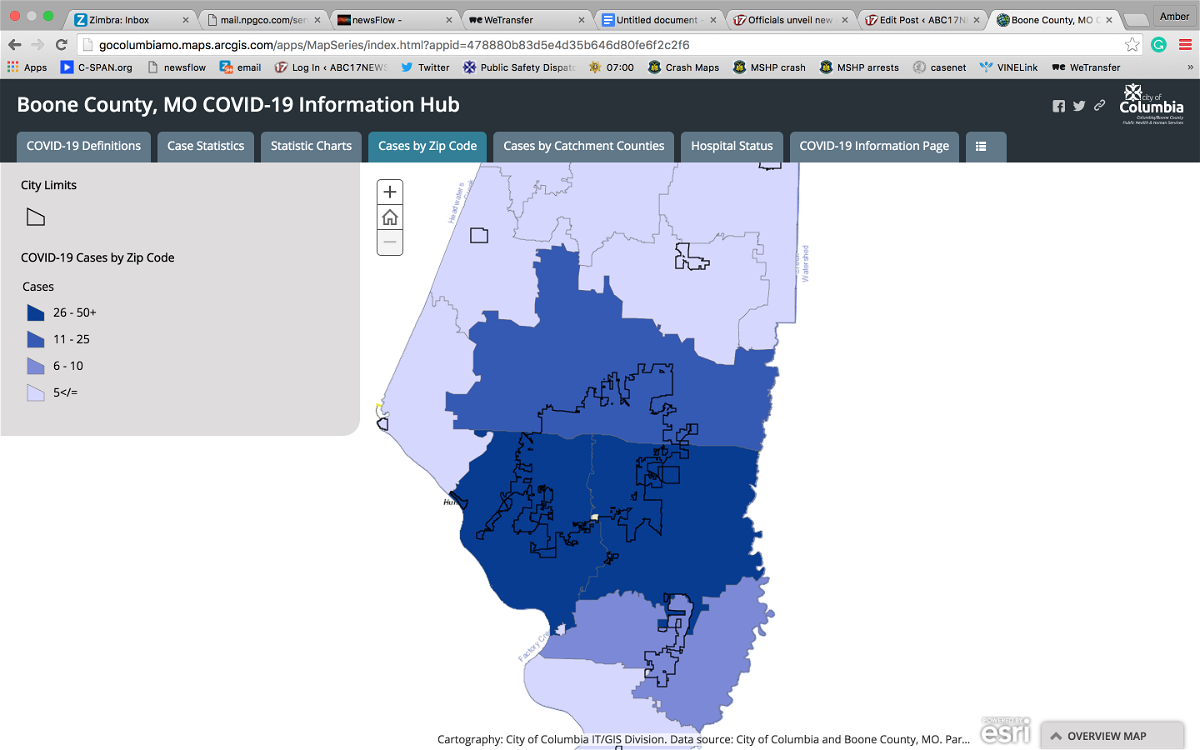
The graph shows what each color represents and how many cases for each area.
Tab five provides the number of cases by catchment area of hospitals in Boone County, with the counties and citizens they serve.
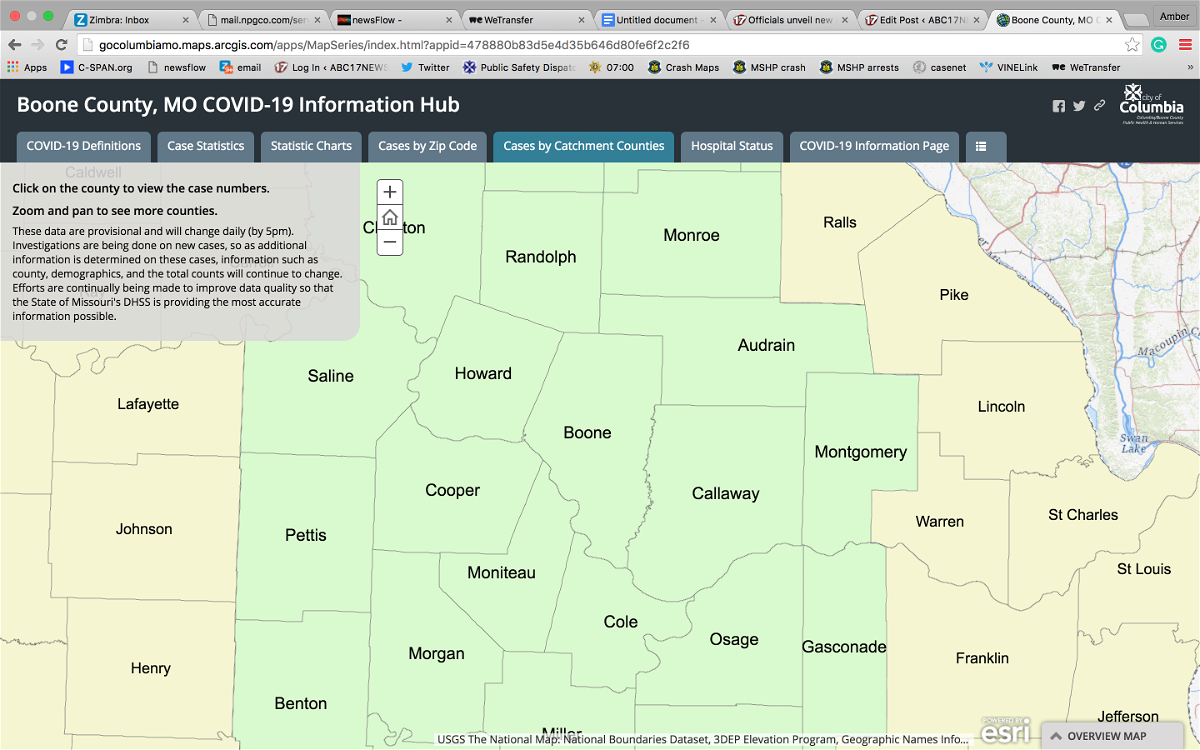
City officials said this is important information to keep any eye on, because this could affect the availability of hospital space and hospital resources in Boone County.
City officials said they meet with their counterparts in area counties once a week.
Tab six displays data monitoring Boone County's hospitals.
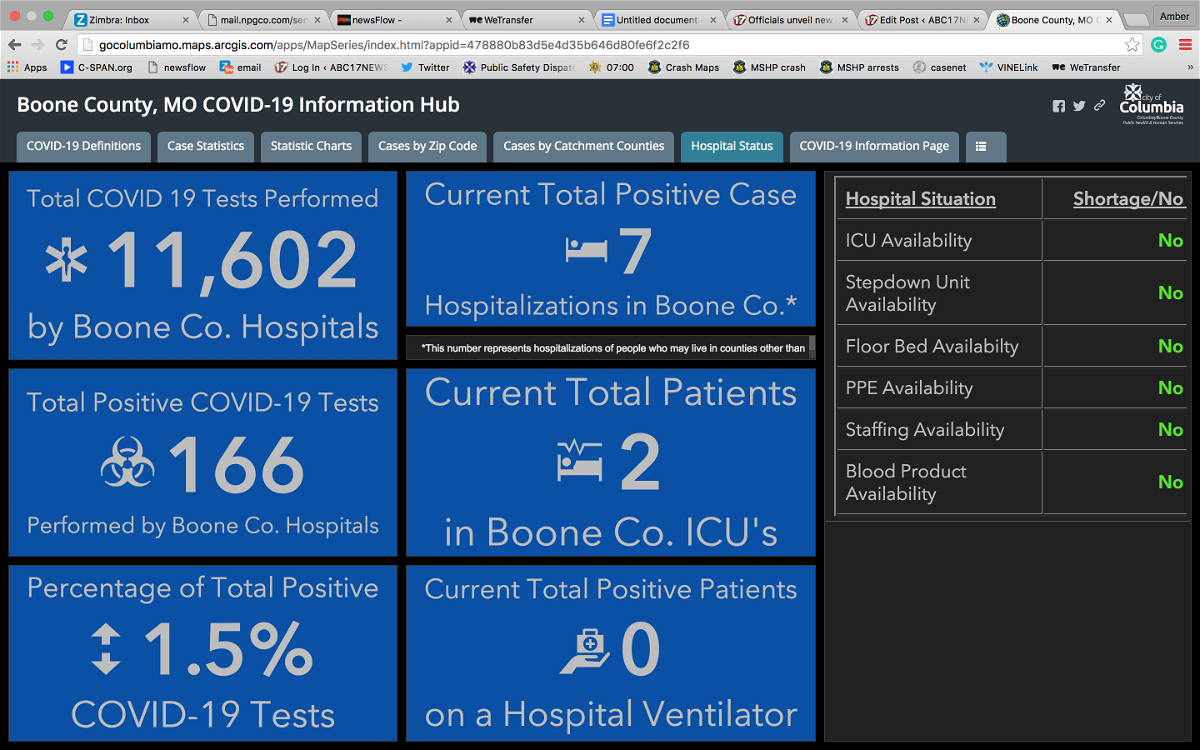
This information includes testing, hospitalizations, including Boone County residents, as well as people from those catchment areas.
The graph shows data regarding positive tests, current total patients in ICU, percentage of total positive COIVD-19 cases and the current total of positive patients on hospital ventilators all in Boone County hospitals.
The other tabs provide information that was previously available on the City of Columbia's website such as press releases and frequently asked questions.
